Figure 3.
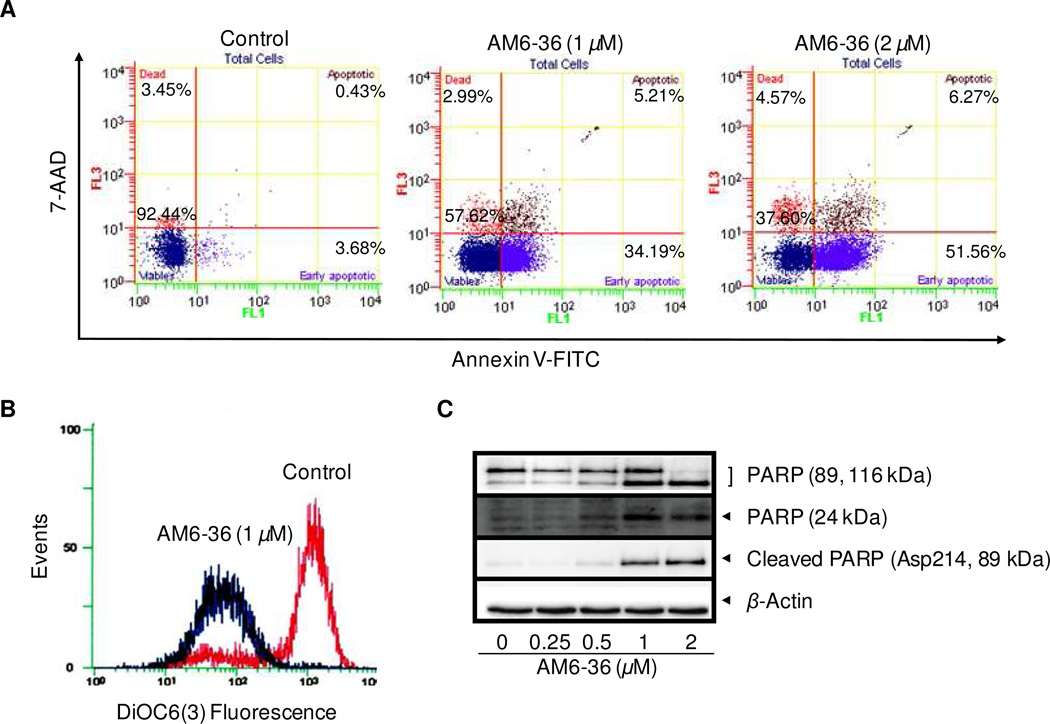
Induction of apoptotic markers by AM6-36 in HL-60 cells. (A) Effect of AM6-36 on Annexin V-FITC/7-AAD double staining: HL-60 cells were treated with AM6-36 for 24 h. The whole cells were collected, and then further incubated with Annexin V-FITC and 7-AAD. After incubation, cells were analyzed by flow cytometry within 30 min. Data are presented as biparametric dot plots showing fluorescence intensity of Annexin-V FITC (FL-1) versus 7-AAD (FL-3). Dots in the each quadrant represent the cell population containing the information on the status of cell viability: Viable cells in the lower left quadrant (Annexin V− 7-AAD−), the early and late apoptotic cells in the lower and upper right quadrant (Annexin V+ 7-AAD−, and Annexin V+ 7-AAD+), and necrotic cells in the upper left quadrant (Annexin V− 7-AAD+). (B) Effect of AM6-36 on the mitochondrial membrane potential: HL-60 cells were treated with AM6-36 (1 µM) for 24 h and incubated with 100 nM of DiOC6(3) for 30 min at 37 °C. The data are demonstrated as histograms of intensity of fluorescence in FL-1 using a flow cytometer. (C) Effect of AM6-36 on the cleavage of PARP: HL-60 cells were treated with the indicated concentrations of AM6-36 for 24 h, and protein expression was assessed by Western blot analysis.

