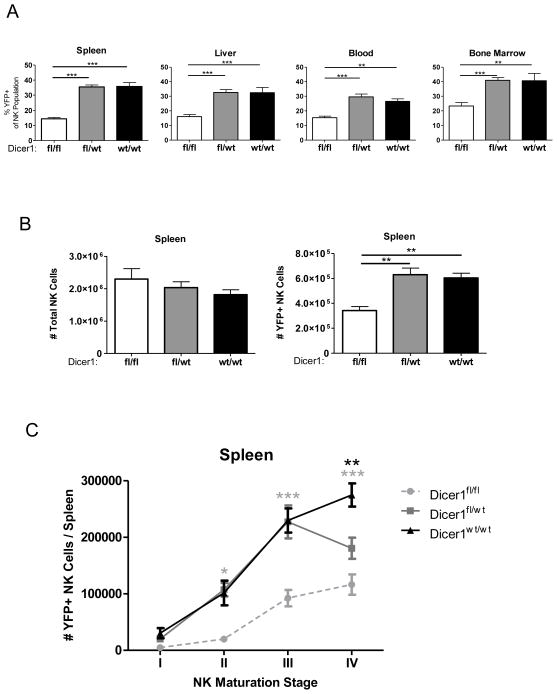
FIGURE 3.
MiRNA-deficient NK cells exhibit an in vivo survival defect. Mononuclear cells were isolated from spleen, liver, blood, and bone marrow. NK cells (CD45+NK1.1+ NKp46+CD3−) were analyzed for YFP expression. (A) Percent YFP positive NK cells in indicated tissues for each genotype. (B) Total viable cells were enumerated, the percentage of YFP+/− NK cells was analyzed by flow cytometry, and absolute total NK and YFP+ NK cell numbers were calculated. (C) NK cells were further analyzed for CD27 and CD11b expression, and the absolute number of cells was calculated as above for maturation stages I (CD27−CD11b−), II (CD27+CD11b−), III (CD27+CD11b+), and IV (CD27−CD11b+) as described (26–29). Significance was calculated using 2-way ANOVA and is presented as Dicer1fl/fl (gray) or Dicer1fl/wt (black) v. Dicer1wt/wt. Data shown are the mean ± SEM of 5 experiments (A–B) or 3 experiments (C). Significance in (A–B) was defined using 1-way ANOVA with a Neuman-Keuls post-test. *p<0.05, **p<0.01, ***p<0.001.

