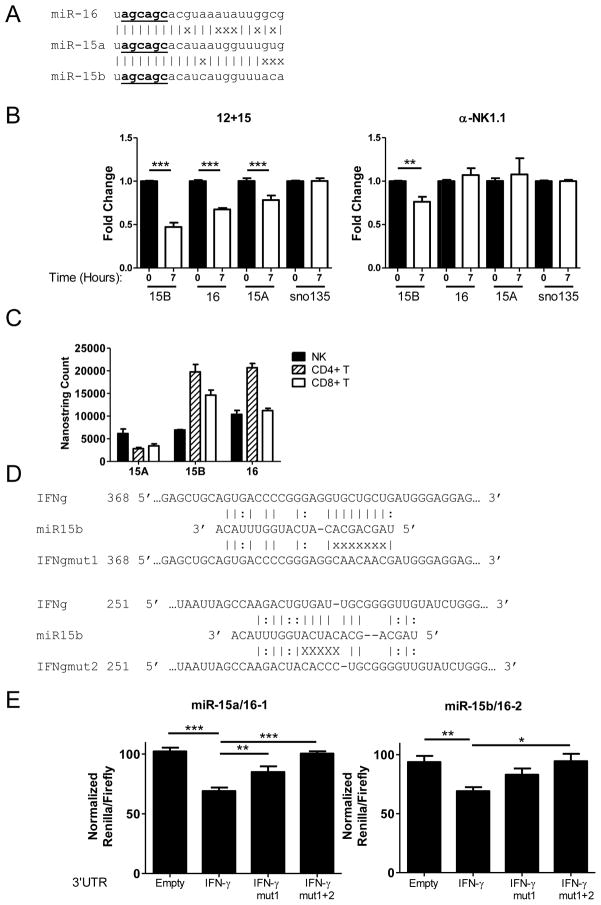
FIGURE 7.
The miR-15/16 family is highly expressed in NK cells, decreases upon cytokine activation, and directly represses the murine IFN-γ 3′UTR. (A) Schematic of the relationship of the miR-15/16 family members. (|) indicates a base pair match, whereas (x) indicates base pair differences. Underlined nucleotides indicate the miRNA “seed” sequence. (B) RT-qPCR of sorted WT NK cells activated at baseline (black) or activated for 7 hours (white) in 100ng/mL IL-15 + 10ng/mL IL-12 (left) or with plate-bound PK136 (right). (C) Nanostring miRNA expression analysis comparing the levels of miR-15/16 in sorted NK, CD4+ T, and CD8+ T lymphocytes illustrating that miR-15/16 is abundant in IFN-γ producing cells. (D) Schematic of two separate predicted mir-15/16 binding sites within the IFN-γ 3′UTR, with Watson-Crick (|) and wobble (:) base pairing indicated. In the mutated IFN-γ 3′UTR sequence, “x” indicates bp location altered to disrupt predicted miR-15/16 binding. Nucleotide numbering indicates position from the 5′ end of the IFN-γ 3′ UTR. (E) 293T cells were co-transfected with the psiCheck2 sensor plasmid under the control of the indicated 3′UTR and a pMND vector over-expressing GFP and either miR-15a/16-1 or miR-15b/16-2. Compared to a GFP-only expression vector, or irrelevant miRNA (miR-21, not shown), mmu-miR-15a/16-1 (left) and mmu-miR-15b/16-2 (right) repress translation via direct targeting of the IFN-γ 3′ UTR. This repression is abrogated when both binding sites are mutated, indicating that miR-15/16 repression is specific. Data shown are the mean ± SEM of at least 2 (B,C) or 3 (E) independent experiments. Significance was calculated using 1-way ANOVA. *p<0.05, **p<0.01, ***p<0.001.

