Figure 1.
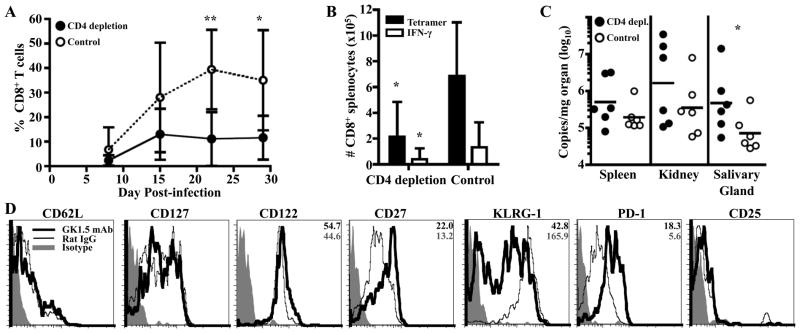
Q9:VP2.139-specific cells depend on CD4 T cell help for expansion. GK1.5 mAb or rat IgG were administered to B6.Kb−/−Db−/− mice coincident with MPyV inoculation and then once weekly for 1 mo. A. Frequency (± SD) of Q9:VP2.139-specific CD8 T cells in blood over time, determined by cell surface Q9:VP2.139 tetramer staining. B. Number (± SD) of Q9:VP2.139-specific CD8 T cells in spleen detected by cell surface Q9:VP2.139 tetramer binding and VP2.139 peptide stimulated intracellular IFN-γ production at d 29 p.i. C. Numbers of MPyV genome copies as determined by qPCR in indicated organs at d 29 p.i. Each point corresponds to an individual mouse, and horizontal lines indicate geometric mean. D. Expression of indicated surface molecules by splenic Q9:VP2-139-specific CD8 T cells on d 29 p.i. Average gMFI valuess are indicated in the top right corner of molecules for which a significant difference was observed between experimental and control groups. Data are representative of six mice per group from two independent experiments. *p < 0.05, **p < 0.01.

