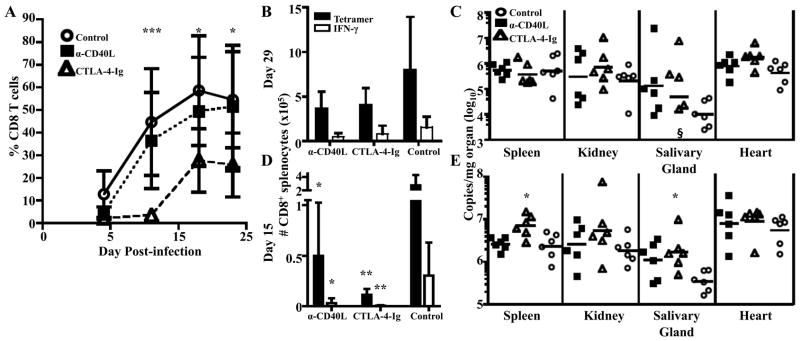
Figure 3.
Expansion of Q9:VP2.139-specific CD8 T cells depends on CD28, costimulation. MR-1 (α-CD40L ) or CTLA-4-Ig were administered to B6.Kb−/−Db−/− mice before and weekly during MPyV infection. Control mice received no Ab. A. Frequency (± SD) of CD8+ Q9:VP2.139-specific cells in the blood over time. Significance indicated is the result of comparing CTLA-4-Ig-treated mice to controls. There was no significant difference between α-CD40L-treated mice and controls. B. Number (± SD) of Q9:VP2.139-specific cells in spleen were determined by tetramer staining and intracellular anti-IFN-γ staining at d 29 p.i. C. Number (± SD) of MPyV genome copies were determined by qPCR in indicated organs at d 29 p.i. D. Number (± SD) of Q9:VP2.139-specific cells in spleen were determined by tetramer surface and intracellular anti-IFN-γ staining at d 15 p.i. Significance indicated is the result of comparing tetramer+ or IFN-γ+ cell numbers of experimental to control mice. E. Number of MPyV genome copies were determined by qPCR in indicated organs at d 15 p.i. For C & E, each point corresponds to an individual mouse, and horizontal lines indicate geometric mean. Data are representative of six mice per group pooled from two independent experiments. §, sample is below the limit of detection. *p < 0.05, **p < 0.01, ***p < 0.001.

