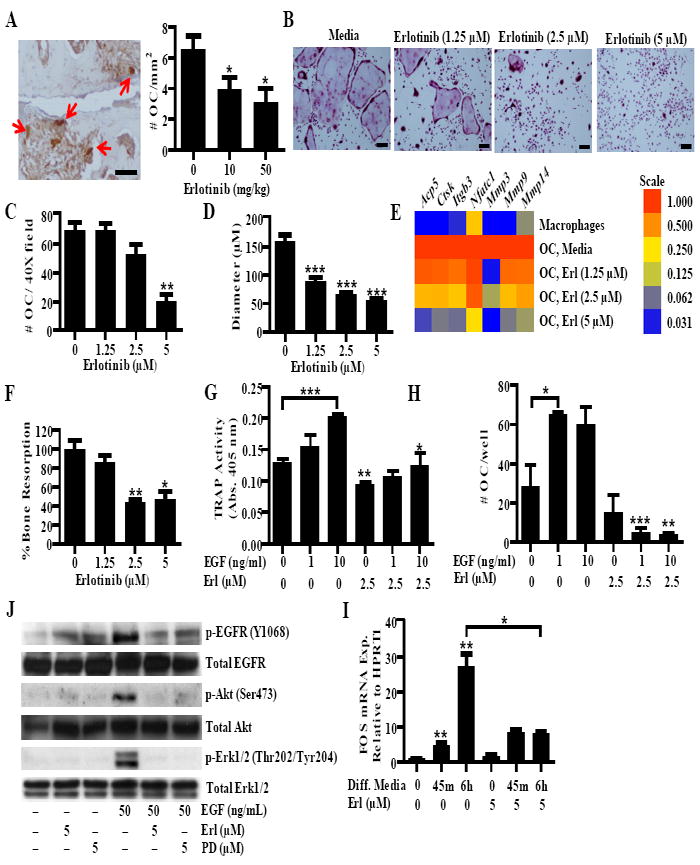
FIGURE 5.

Erlotinib inhibits osteoclastogenesis. A, Paw sections from CIA mice treated with vehicle or erlotinib were stained for TRAP. Arrows indicate osteoclasts defined as large, TRAP+ cells adjacent to bone. The number of osteoclasts was quantified for each treatment group. B-E, Osteoclasts were treated with erlotinib during the differentiation period and stained for TRAP. B, Representative pictures were taken, and the (C) number of osteoclasts and (D) relative diameter was determined using Image J analysis. For quantification, osteoclasts were defined as TRAP+ cells with three or more nuclei. E, Expression of osteoclast specific genes and mmps was quantified in macropahges and osteoclasts treated with erlotinib. Gene expression was normalized to Hprt1 and the level was arbitrarily set to 1 in untreated osteoclasts. F, Osteoclasts were grown on dentin discs and bone resorption was analyzed by toluidine blue staining and image analysis. Data is normalized to the level of untreated osteoclasts. G and H, Osteoclasts were differentiated in the presence of EGF. At day seven, TRAP activity was measured by an (G) enzymatic reaction and the (H) number of osteoclasts per well was counted. I, Osteoclasts were pretreated with either erlotinib (5 μM) or PD153035 (5 μM) and stimulated with EGF (50 ng/ml) for 5 minutes and western blots were performed. J, Monocytes were treated with serum free differentiation media containing M-CSF and RANKL for 45 minutes (min) and six hours (h). Fos expression was determined by QPCR. B-D, G-J, Data represent one experiment of at least three independent experiments E-F, Data represent one experiment of at least two independent experiments. For all experiments (*P < 0.05; ** P < 0.01; *** P < 0.001). A and B, bars represents 150 μm. OC, osteoclast. Error bars indicate ± SEM.
