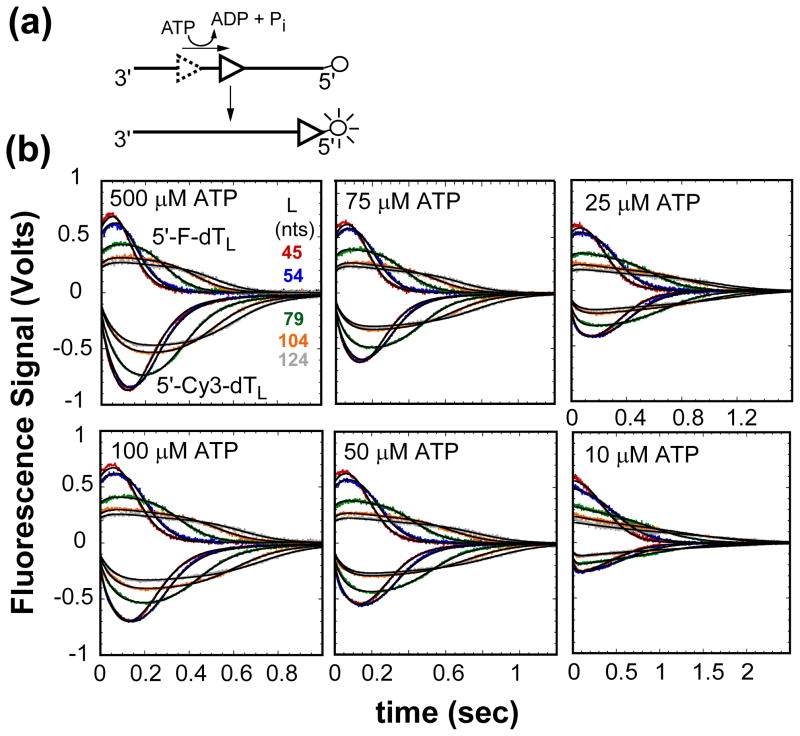
Figure 1.
Kinetics of UvrD monomer translocation monitored by the arrival of UvrD at the 5′-end of fluorescently labeled (dT)L as a function of ATP concentration. (A)- Cartoon depicting translocation assay. UvrD (triangle) binds randomly to ssDNA. Upon addition of ATP UvrD translocates 3′ to 5′ along the ssDNA. When UvrD reaches the 5′-end with a covalently attached fluorophore it either quenches or enhances the fluorescence of the fluorophore. (B)- UvrD is pre-incubated with either excess 5′-Cy3-dTL or 5′-F-dTL in T20 buffer then rapidly mixed with ATP, MgCl2, and heparin in T20 buffer at 25°C to initiate translocation. The top portion of each panel has the time courses for translocation on Cy3 labeled ssDNA and the bottom portion has the time courses for translocation on fluorescein labeled ssDNA at the given ATP concentration. The smooth black curves are simulations using eq. (1) and the best-fit parameters determined from a combined global NLLS analysis of the time courses (Table 1).

