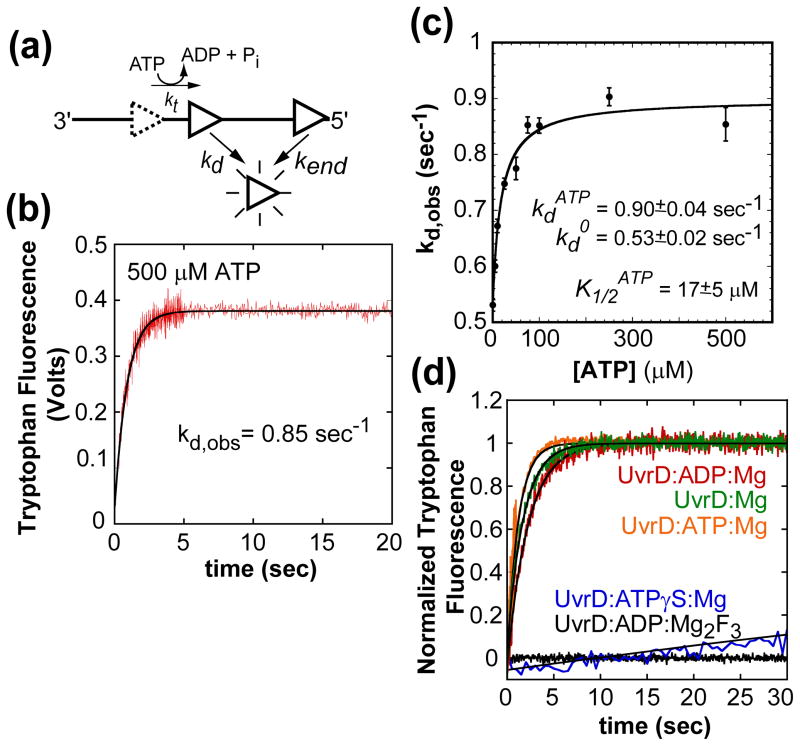
Figure 2.
UvrD monomer dissociation kinetics from internal sites of ssDNA during translocation as a function of ATP concentration. (A)- Cartoon depicting assay for UvrD dissociation during ssDNA translocation. (B)- Time course of UvrD monomer (25 nM, post mix) dissociation from poly(dT) (10 μM nts, post mix) (1.5 ± 0.05 kb), (buffer T20, 500 μM ATP, 2 mM MgCl2, and 4 mg/ml heparin, 25°C) fit to a single exponential. (C)- The observed kd as a function of ATP concentration fit to a hyperbola, fit parameters shown in plot. The dissociation time courses at each ATP concentration were fit to a single exponential (data not shown). (D)- Time courses of UvrD dissociation from ssDNA in the absence of nucleotide, ADP, ATPγS, and ADP:Mg2F3 fit to a single exponential. The observed kdNo Nucleotide= 0.58 ± 0.02, kdADP= 0.42 ± 0.02, and kdATPγS= 0.005 ± 0.001.

