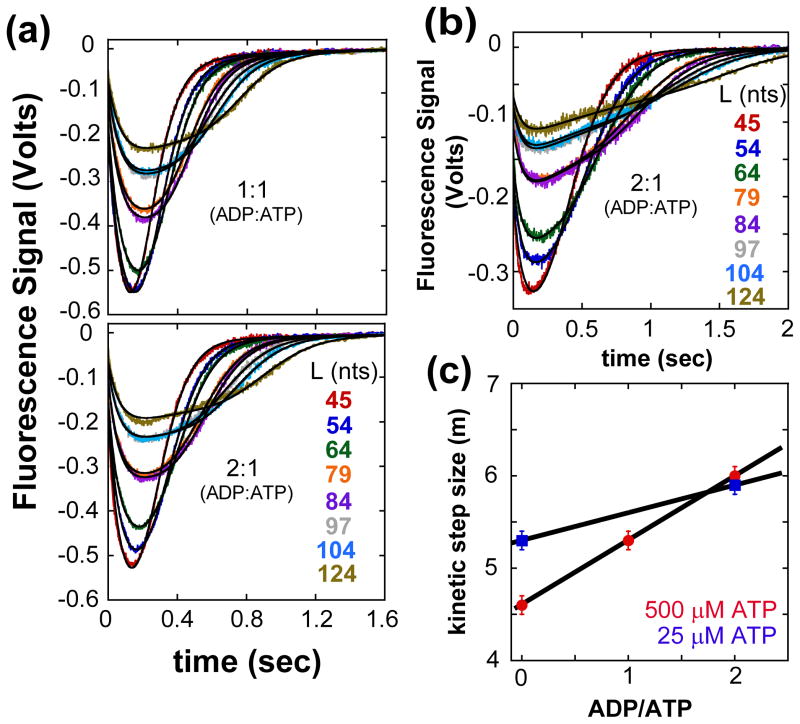
Figure 6.
Kinetics of UvrD monomer translocation monitored by the arrival of UvrD at the 5′-end of 5′-F-(dT)L in the presence of different molar ratios of ADP:ATP. UvrD is pre-incubated with excess 5′-F-dTL in T20 buffer then rapidly mixed with ATP, ADP, MgCl2, and heparin in T20 buffer at 25°C to initiate translocation. (A)- Translocation time courses at 1:1 and 2:1 ADP:ATP concentration ratios at a constant ATP concentration of 500 μM ATP. (B)- Translocation time courses at 2:1 ADP:ATP concentration ratio at constant ATP concentration of 25 μM ATP. The smooth black curves are simulations using eq. (2) and the best-fit parameters determined from a combined global NLLS analysis of the time courses (Table 2). (C)- The observed translocation kinetic step size as a function of ADP:ATP ratio. The kinetic step size was determined as in Figure S2A.

