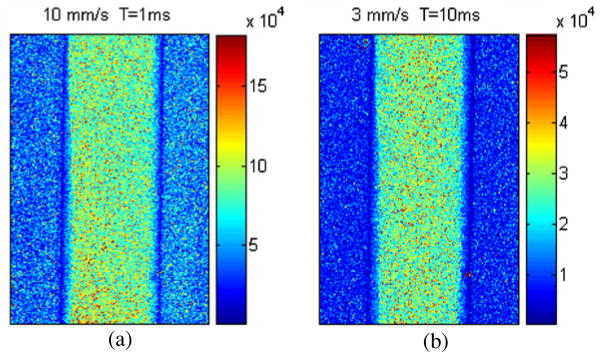
Figure 5.
Maps of in vitro flow rate predicted with our mLSI model (equation (5)) for actual flow rates of (a) 10 mm s−1 and (b) 3 mm s−1. Exposure times of 1 and 10 ms were used to work within the linear response range of our instrument for the two actual flow rates.

