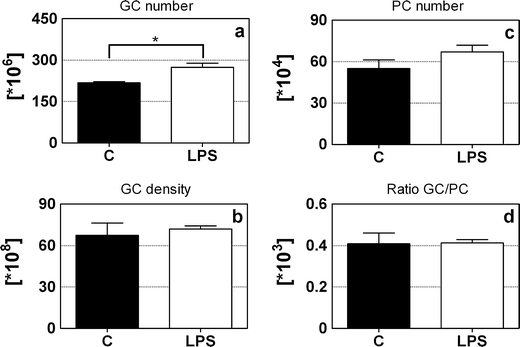
Fig. 6.

The total number of granule and Purkinje cells. The mean total number (a) and density (b) of granule cells, the mean total number of Purkinje cells (c), and the ratio granule cells/Purkinje cells (d) of control (closed bars) and LPS-exposed animals (open bars). LPS-injected animals had significantly more granule cells than control animals. *p < 0.05; MANOVA. GC granule cells, PC Purkinje cells
