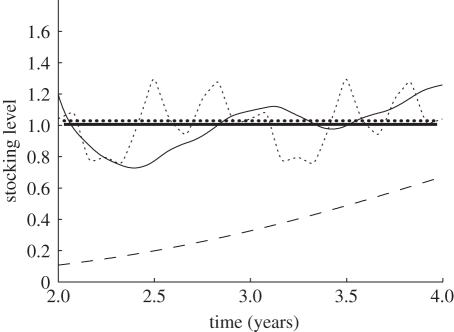
Figure 3.
Use of the static approximation to estimate critical stocking level from lice abundances at subcritical stocking levels. The abundance and stocking data were taken from years 1–4 of the numerical simulation shown in electronic supplementary material, figure S1. The dashed line is the actual stocking level. The thin dotted line is the true, time-varying critical stocking level, calculated using equation (3.2). The thick dotted line shows its median over the 2 year interval. The thin solid line is the critical stocking level estimated using relation (5.2) and plotted over time t2, with t1 a year earlier than time t2. The thick solid line is the median of those interval estimates. Although the interval estimates of critical stocking level are inaccurate, the two medians are nearly indistinguishable. Years 8–11 of electronic supplementary material, figure S1 give a similar result.

