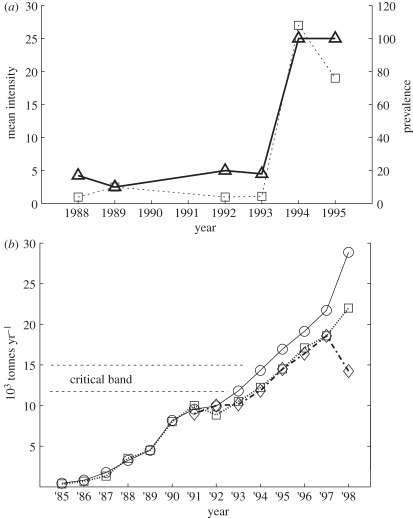
Figure 4.
(a) Mean intensity (squares; average lice per infected host; left scale) and prevalence (triangles; right scale) of L. salmonis on farmed salmon in the Quoddy Region [31]. (b) New Brunswick farmed salmon production. (Nearly, all production is from the Quoddy.) The band shown here is an estimated critical production band for husbandry without treatment of fish for lice. The corresponding critical stocking band can be obtained by multiplying the production band by grow-out time (1.5–2 years). The drop of production in 1998 is due to an epidemic of infectious salmon anaemia that required eradication of fish on 20 farms. Production estimates are from the New Brunswick Department of Agriculture and Aquaculture (circles), Statistics Canada (diamonds) and the New Brunswick Salmon Growers Association (squares).

