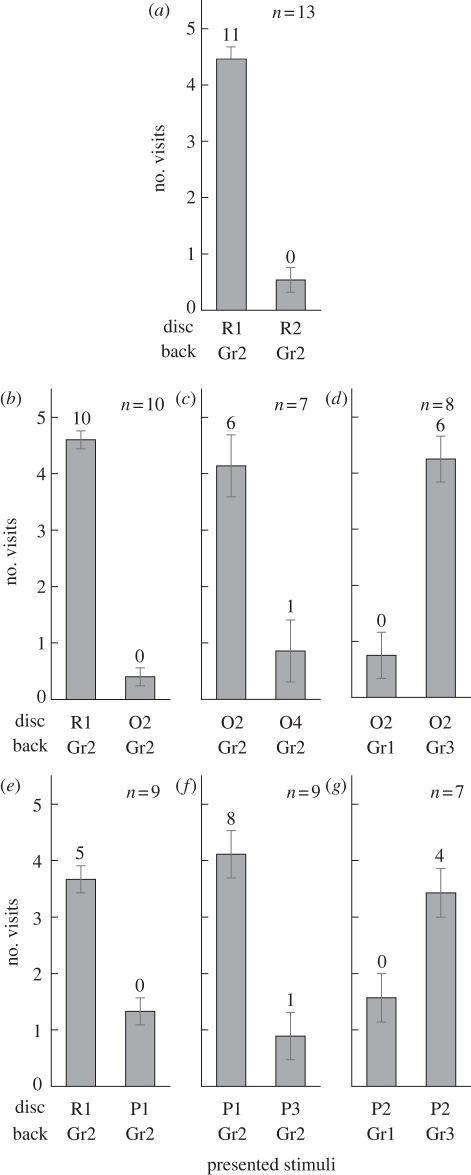
Figure 3.
Effects of training to high intensity red (R1). (a) Control test (R1; p = 3.90 × 10⁻¹², R2; p = 0.43, binomial test). (b) Test 1 (colour discrimination) with orange (O). R1; p = 9.09 × 10⁻¹³, O1; p = 0.52. (c) Test 2 (intensity discrimination) with O. O2; p = 3.91 × 10⁻⁷, O4; p = 0.27. (d) Test 3 (simultaneous brightness contrast) with O. Gr1; p = 0.60, Gr3; p = 1.47 × 10⁻⁶. (e) Test 1 with purple (P). R1; p = 9.28 × 10⁻⁵, P1; p = 0.56). (f) Test 2 with V. P1; p = 1.96 × 10⁻⁹, P3; p = 0.34. (g) Test 3 with P. Gr1; p = 0.64, Gr3; p = 4.4 × 10⁻⁴. Coloured paper details shown in figure 1. Numbers above each column indicates the number of individuals that visited the disc more than four times out of their five visits. Error bars show s.e.

