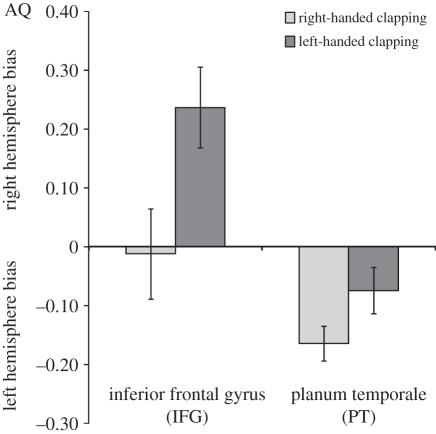
Figure 3.
Degree and direction of neuroanatomical asymmetries (AQ scores) for the inferior frontal gyrus (IFG) and the planum temporale (PT) in left-handed (n = 13 for the IFG; n = 16 for the PT) and right-handed subjects (n = 21 for the IFG; n = 22 for the PT) for clapping. AQ values varied on a continuum with positive values indicating right hemisphere biases and negative values indicating a left hemisphere bias.

