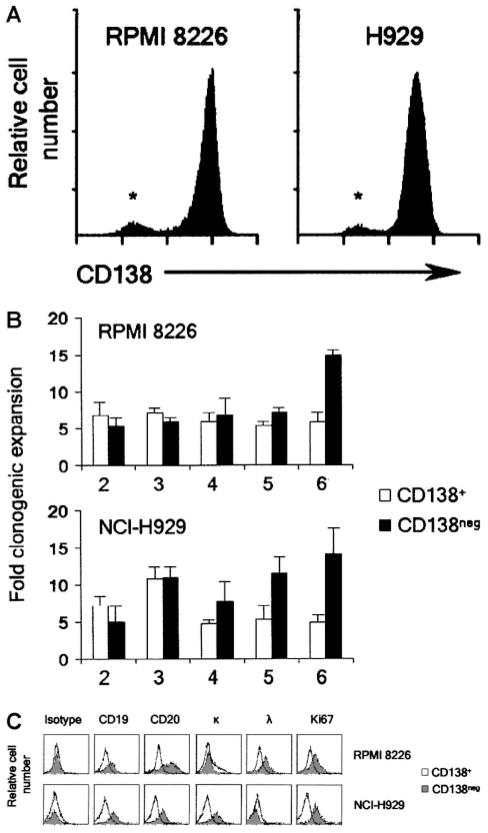
Figure 1. Clonogenicity of MM cell lines by CD138 expression.
(A) Flow cytometric evaluation of CD138 expression by RPMI 8226 (λ light chain restricted) and NCI-H929 cells (κ light chain restricted). * denotes CD138− population. (B) Clonogenic expansion of CD138+ and CD138− RPMI 8226 and NCI-H929 cells during serial replating. Results are the mean ± SEM of 3 separate experiments for each cell line and represent the fold clonogenic expansion expressed as a ratio of number of colonies scored compared to the previous plating. P < .02 following the fifth and sixth transfer of both cell lines by Student t test. X-axis represents round of serial replating. (C) Flow cytometric evaluation comparing additional antigens expressed by CD138+ and CD138− RPMI 8226 and NCI-H929 cells.

