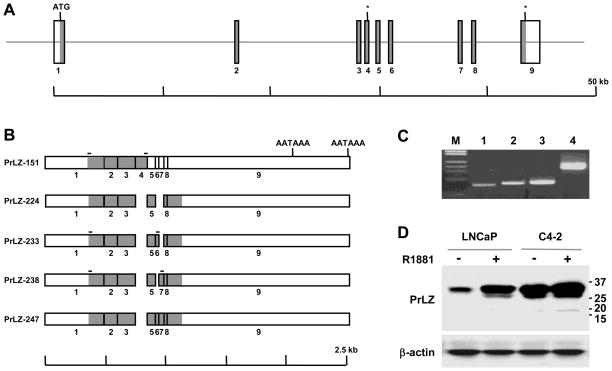
Figure 1. Structure of the PrLZ gene and alternatively spliced isoforms.
A, schematic presentation of PrLZ gene organization. Exons are shown as vertical bars and coding regions are shaded in gray. The translation start site is marked (ATG) and two in frame stop codons are marked with asterisks (*). Note that sizes of the exons are not in scale. B, schematic presentation of the PrLZ cDNA sequences due to alternative splicing. Two polyadenylation signals (AATAAA) are marked. On top of each scheme the location of primers used for RT-PCR detection of specific transcripts is marked with a horizontal bar. C, RT-PCR detection of the alternatively spliced transcripts in C4-2 prostate cancer cells. Specific transcripts detected are PrLZ-151 (lane 1), PrLZ 233 (lane 2), and PrLZ-238 (lane 3). GAPDH was used as control (lane 4). Commercial λHindIII/ΦX174HaeIII was used as a DNA marker (M). D, Western blot detection of PrLZ isoforms. In the upper panel, whole cell lysates (40 μg) of LNCaP and C4-2 cells treated with R1881 (+) were subjected to western blotting for PrLZ. Sizes (kD) of the bands were indicated on the right. The result is representative of two separate experiments. In the lower panel, the level of the β-actin was used as a loading control.

