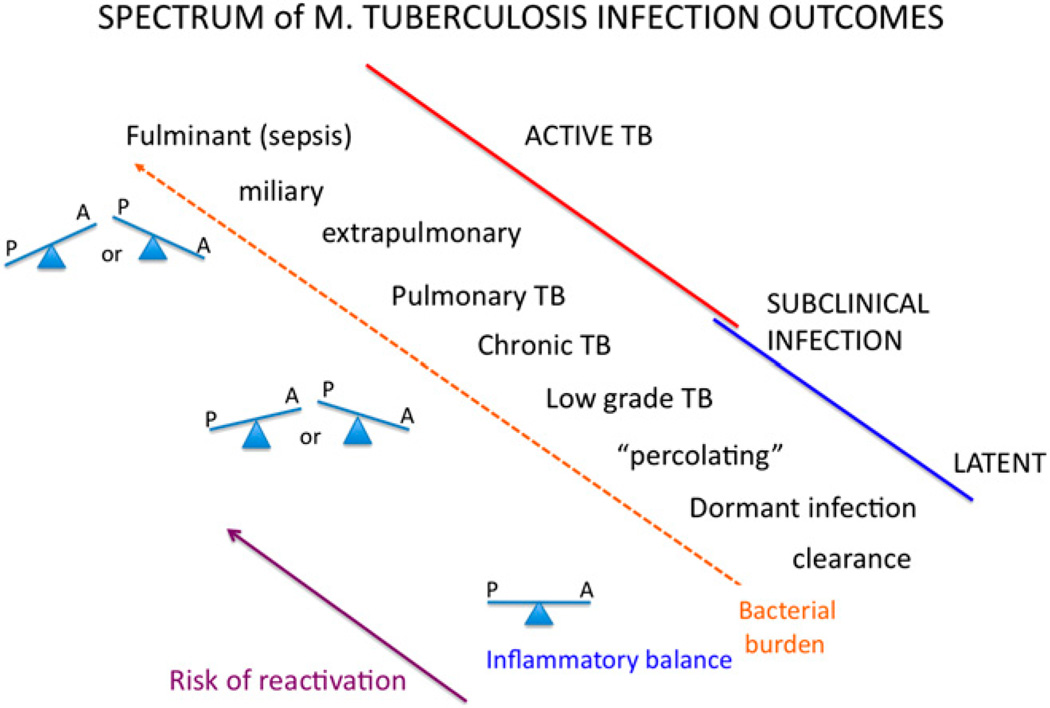
FIGURE 1.
The spectrum of M. tuberculosis infection outcome is depicted. The clinical outcomes of active (red line) and latent (blue line) infection are subdivided to reflect the variability of infection in those categories. Bacterial burden, shown by the dashed orange line, is expected to increase up the spectrum of infection. The seesaws reflect the balance of pro- (P) and anti-inflammatory (A) factors in the granuloma. At the lower end of the latency spectrum, these two factors are well balanced, controlling bacterial growth with minimal pathology. As one advances up the spectrum, the balance can shift with either too much proinflammatory or too much anti-inflammatory activity, which can lead to poor control of bacteria and increased pathology. The purple line reflects the risk of reactivation in the latent spectrum.

