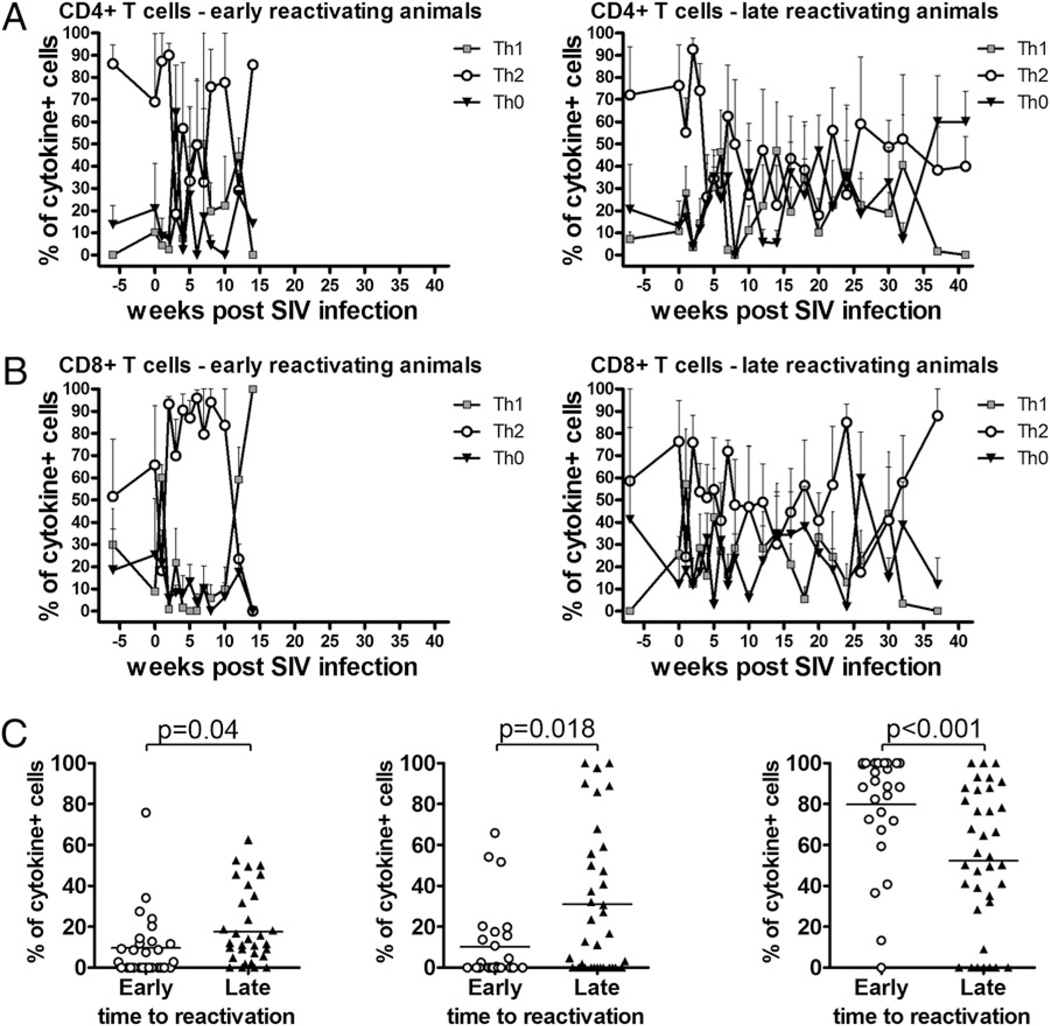
FIGURE 6.
Early and late reactivating animals show differences in frequencies of Th0-, Th1-, and Th2-polarized CD8+ T cells. Responses of CFP-stimulated cells were combined to reflect populations of Th1-polarized (IFN-γ), Th2-polarized (IL-4+IL-10+, IL-4+, or IL-10+), or Th0-polarized (IFN-γ+IL-4+IL-10+, IFN-γ+IL-4+, or IFN-γ+IL-10+) T cells. A, CD4+ T cell responses. B, CD8+ T cell responses. Data represent the mean frequency of cytokine-expressing cells ± SEM; lower error bars have been omitted for clarity. C, CD8+ T cell phenotypes were determined as previously described and the response for weeks 1–10 obtained by pooling the responses for early and late reactivating monkeys. Pre-SIV phenotypes were not significantly different between groups of animals (data not shown). Early reactivating animals had significantly fewer Th0- and Th1-polarized CD8+ T cells (p = 0.004 and p = 0.018, respectively; Mann–Whitney U) and more Th2-polarized CD8+ T cells (p < 0.001; Mann–Whitney U).

