
Figure 3. Phenotypic Characterization of Tumor-antigen Cross-presenting Dendritic Cells.
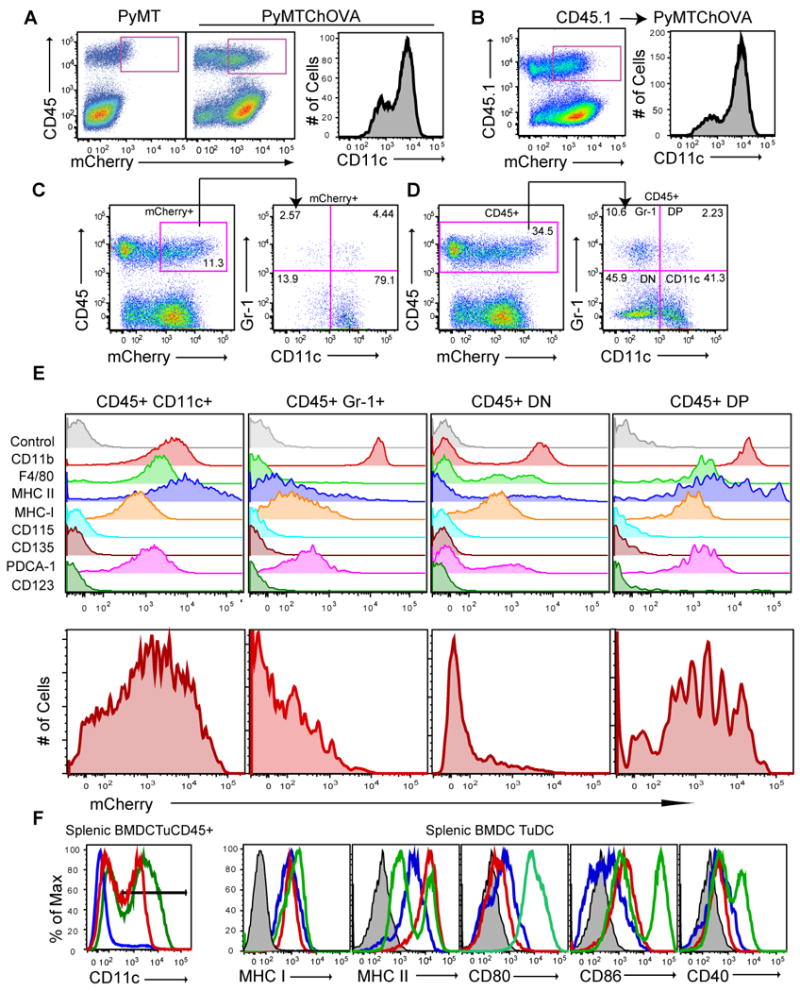
A. Flow cytometry of CD45 expression versus mCherry levels from digested tumors from PyMT (left) or PyMT ChOVA (middle) mice. CD11c levels of gated CD45+ mCherry+ cells (right) from previous dot plot.
B. As A, but from bone marrow chimera made by adoption of CD45.1 bone marrow cells into an irradiated PyMT ChOVA mouse.
C. CD45 expression versus mCherry levels from digested tumor from PyMT ChOVA mouse, gated CD45+ mCherryhi cells were propagated to subsequent dot plot, and analyzed for their expression of CD11c and Gr-1.
D. CD45 expression versus mCherry levels from digested tumor from PyMT ChOVA mouse, gated CD45+ cells were propagated to subsequent dot plot and analyzed for their expression of CD11c and Gr-1.
E. Gated and labeled populations from D. were analyzed for their expression of the listed cell surface markers or for their mCherry fluorescence level.
F. CD11c+ cells from either the spleen of B6 mice, BMDC cultures or the tumor of PyMT ChOVA mice. Gate in left histogram propagated to subsequent histograms.