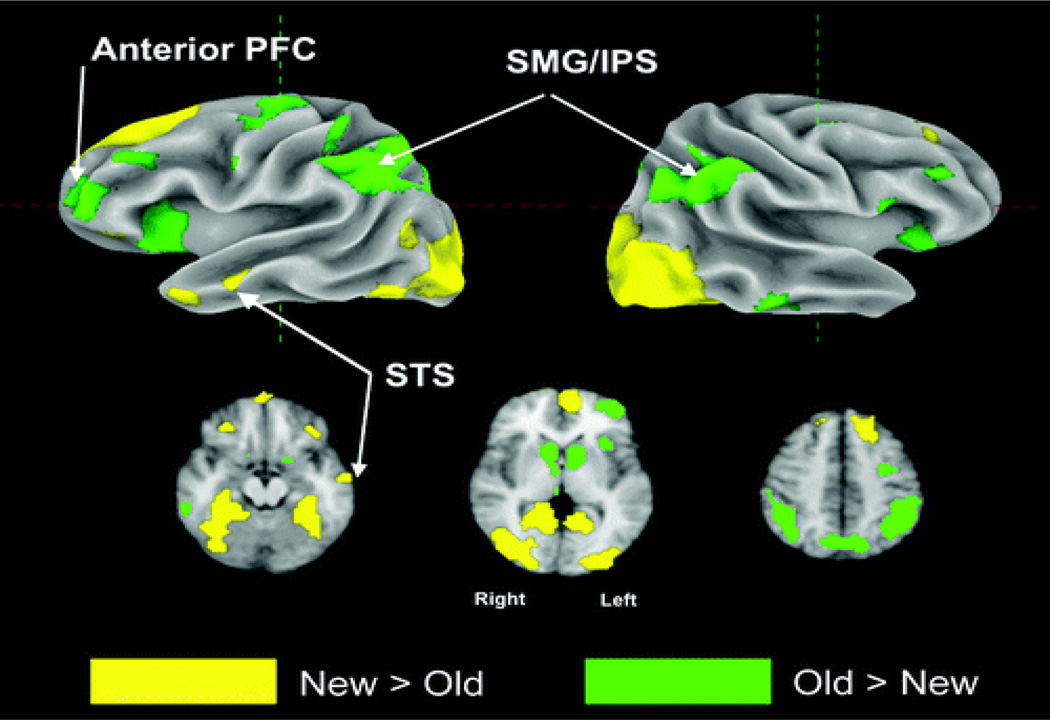
Figure 2.
Top row: Surface rendering of group contrast old versus new, threshold at p < .001, two-tailed. Areas where old (hits) > new are shown in green colors. Areas where new (correct rejections) > old are shown in yellow colors. Bottom row: Three axial slices show old versus new group contrast with same color scheme as above.

