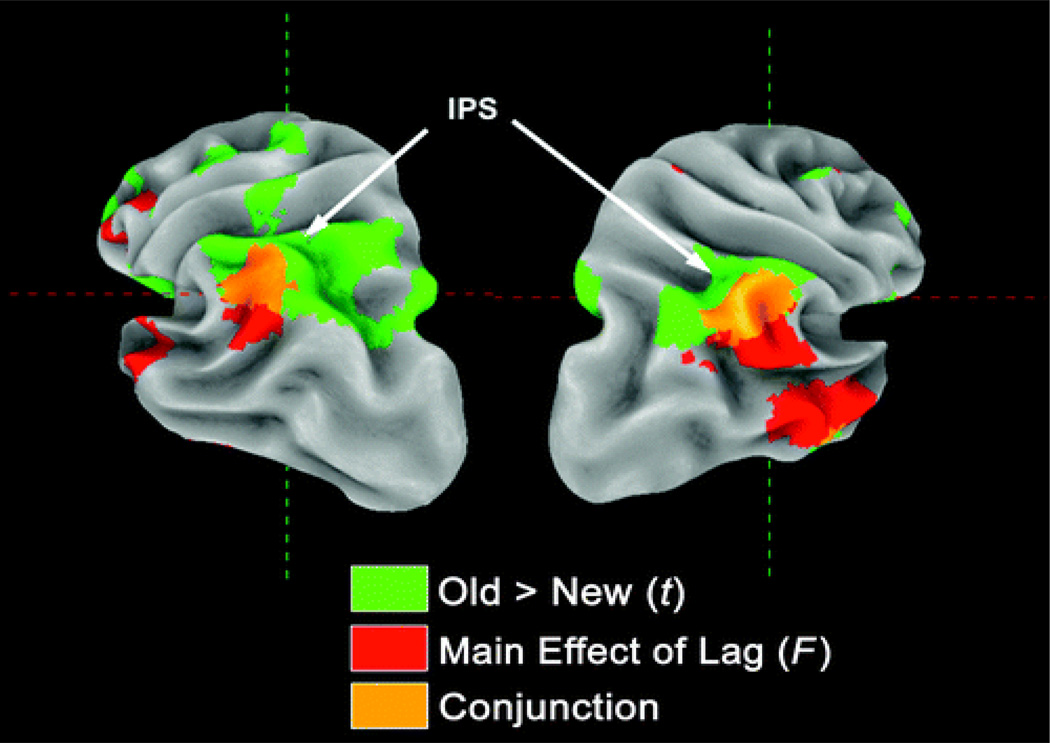
Figure 4.
Left hemisphere surface rendering showing cluster maxima for the main effect of lag. Adjacent to each cluster is a plot of mean activity as a function of lag. 1 = superior temporal gyrus; 2 = superior temporal gyrus/superior temporal sulcus; 3 = left lateral parietal lobe; 4 = inferior frontal gyrus; 5 = ventral anterior prefrontal cortex.

