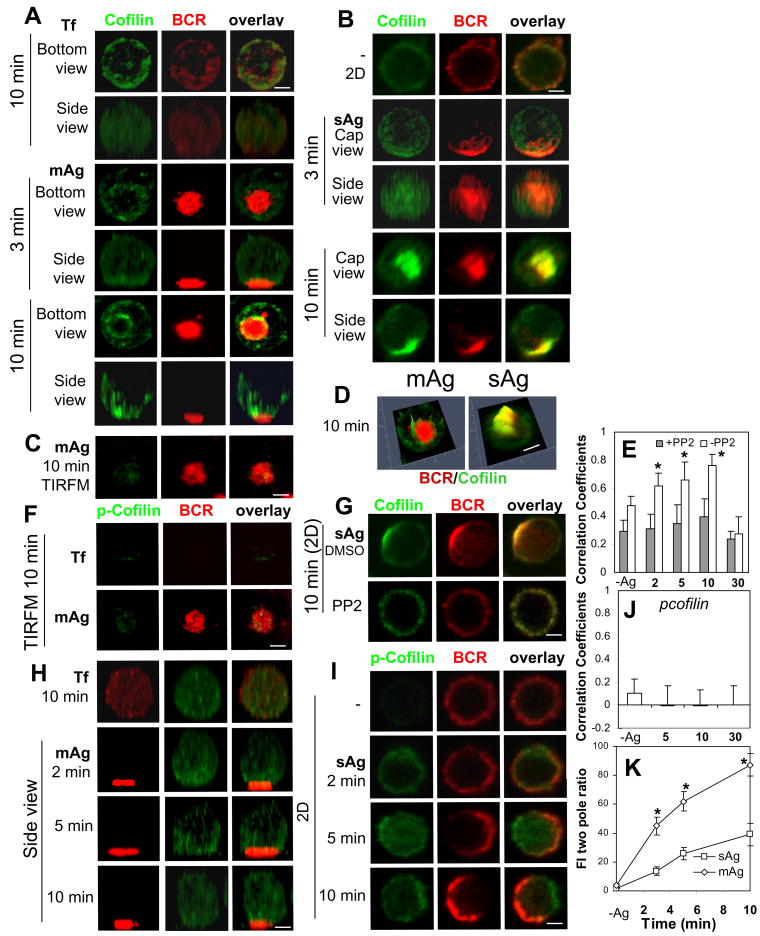
Figure 3.
Both membrane-associated and soluble antigens induce the recruitment of cofilin in a signaling-dependent manner. Splenic B-cells were incubated with AF546-mB-Fab′-anti-Ig tethered to lipid bilayers (mAg) at 37°C for indicated times. Cells were fixed, permeabilized, stained for cofilin (A and C) and phosphorylated cofilin (p-cofilin) (F and H), and analyzed by 3-D CFM (A and H) and TIRFM (C and F). Splenic B-cells pretreated without (B and I) or with PP2 (G) were incubated with AF546-mB-Fab′-anti-Ig without (-) or with streptavidin (sAg) at 4°C, washed, and warmed to 37°C for varying lengths of time. After fixation and permeabilization, the cells were stained for cofilin (B and G) or p-Cofilin (I), and analyzed using CFM. Fluorescence intensity profiles (2.5-D) of cofilin and BCRs in B-cells stimulated by mAg and sAg for 10 min were generated using Zen software (D). The Pearson's correlation coefficients between BCR and cofilin (E) or p-cofilin (J) staining were determined. The fluorescence intensity ratio of cofilin at the BCR central cluster to that at its opposite pole (FI two pole ratio) in B-cells stimulated by mAg and sAg was determined using Andor iQ software (K). Shown are representative 2-D, 2.5-D, 3-D CFM and TIRFM images at indicated times and the average values (±SD) of ∼50 cells from three independent experiments. Scale bars, 2.5 μm. * p<0.01 compared to PP2 treatment in E and compared to sAg in I.

