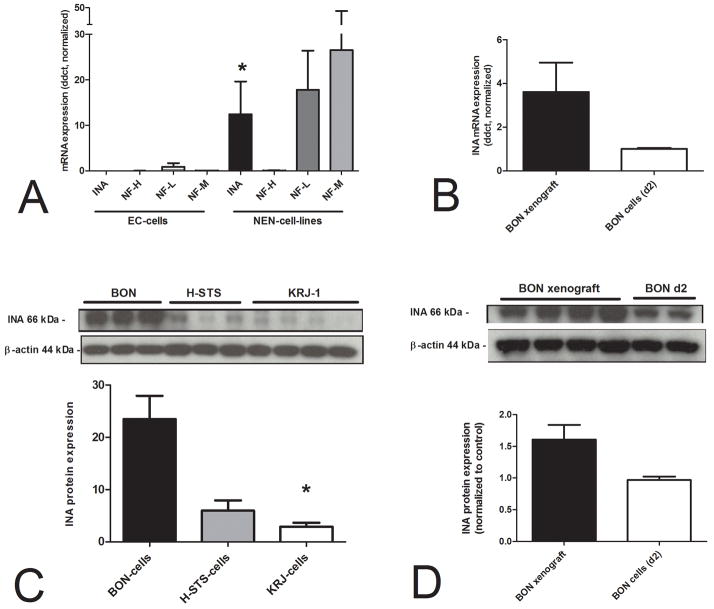
Figure 2.
RNA expression of neurofilaments in normal EC cells (n=9 preparations), 6 individual NEN cell lines (2 BON, 3 STS, 1 KRJ-1)and murine xenograft models. INA mRNA was expressed at a significantly higher level in the NEN cell lines in comparison to normal EC cells (2A,*p=0.0008). INA protein was expressed in all three different cell lines (3 samples BON-, 3 samples H-STS-, 4 samples KRJ-1-cells), but was significantly higher in the adherent BON cells (2C, *p=0.03). BON cell xenografts, grown subcutaneously in mice, exhibited higher INA both at an mRNA (2B) and protein level (2D) compared to BON cells(logarithmic growth phase day 2) in vitro.

