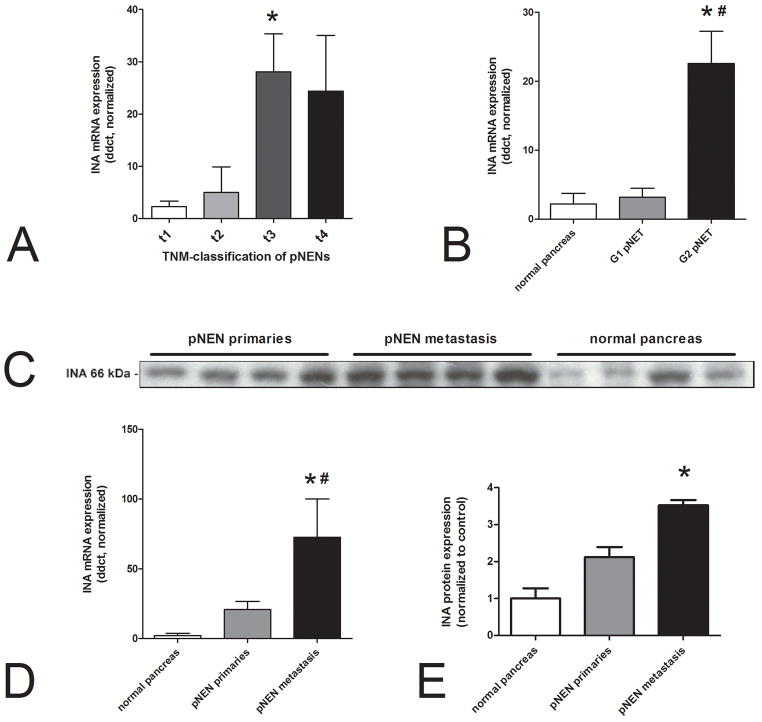
Figure 6.
INA expression in pNENs as a function of tumor size, grade and metastasis. INA transcripts were significantly over-expressed in t3 pNENs compared to t1 (p=0.015) (6A) as well as in G2-pNETs compared to normal pancreas (*p=0.002)and to G1-pNETs(#p<0.05) (6B). INA mRNA was significantly elevated in pNEN metastases in comparison to normal pancreas (*p=0.003) and primaries (#p=0.02) (6D). At protein levels INA expression was higher in metastases (p<0.01) (6C,E).

