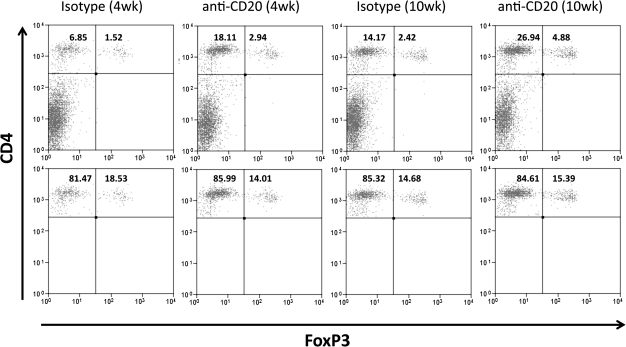
Fig. 4.
Flow cytometric analysis of Foxp3+ Treg in anti-CD20-treated Foxp3 GFP NOD.H-2h4 mice. The top panels show representative results for Foxp3+ cells as a percentage of the total splenocytes. The percentage of CD4+ T cells for each group is the sum of the upper left and upper right quadrants. In the bottom panels, splenocytes are gated on CD4+ T cells and the percentage of Foxp3+ Treg expressed as a percentage of CD4+ T cells is indicated in the upper right quadrant. Results are representative of the groups shown in Table 3.

