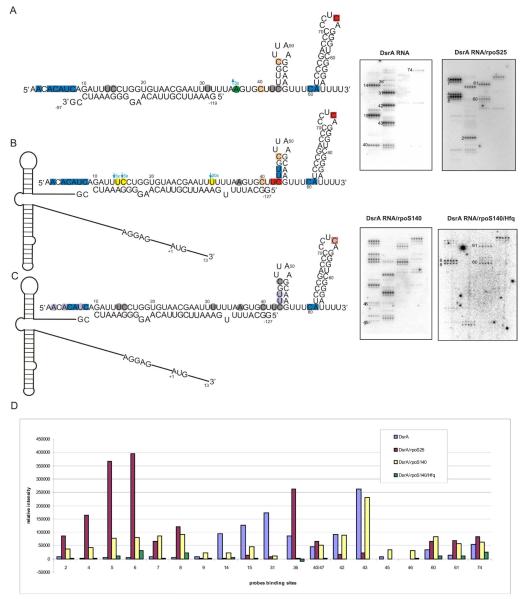
Figure 3.
Isoenergetic microarray mapping results for DsrA RNA in complex with (A) rpoS25 (B) rpoS140 (C) rpoS140 and Hfq. (D) Bar graph of relative binding intensity to the probes. Red squares represent sites of binding to probes which have the same intensity relative to DsrA RNA alone. Orange squares represent two sites which can bind to the same probe and have the same intensity relative to DsrA RNA alone. Blue squares represent additional binding sites to probes in the presence of rpoS or rpoS and Hfq. Grey circles represent lack of binding relative to DsrA RNA alone. Yellow circles represent decreased binding in the presence of rpoS140. Green circles represent decreased binding in the presence of rpoS25. Purple circles represent lack of binding relative to complex DsrA RNA/rpoS140.

