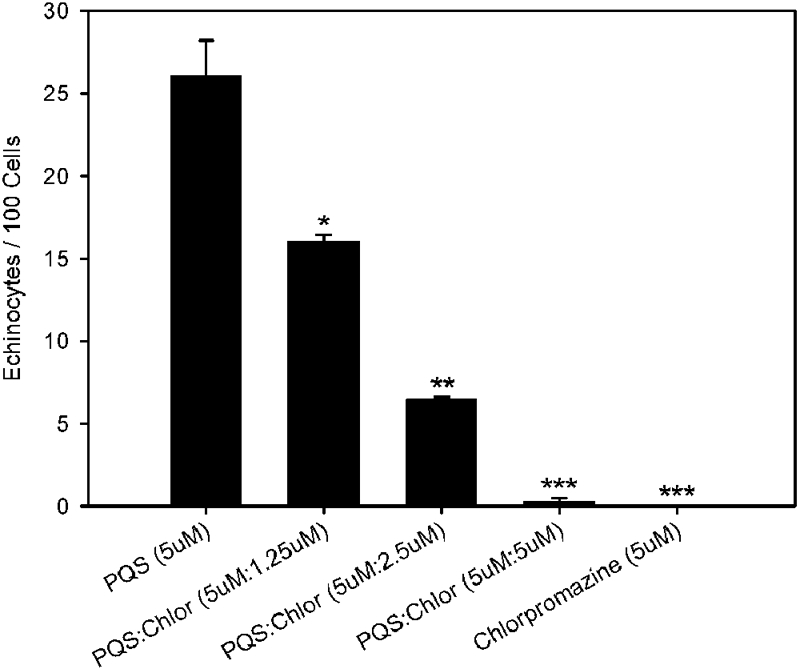
FIG 4 .

The PQS effect is antagonized by chlorpromazine. Washed RBCs were exposed to PQS, both PQS and chlorpromazine, or chlorpromazine alone. The bars represent the average numbers of echinocytes per 100 cells. Averages were calculated from at least three independent measurements (≥6,800 total cells). Error bars show the standard errors. Asterisks represent statistically significant differences from PQS (5 µM) using a one-tailed t test. *, P < 0.05; **, P < 0.0002; ***, P < 0.0001. Chlor, chlorpromazine.
