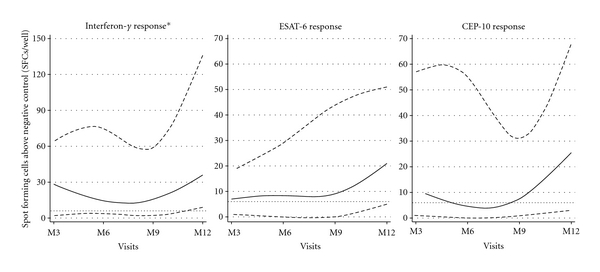
Figure 2.

Change in magnitude of interferon-γ and antigen-specific response during postpartum. The solid lines represent the median response, and the two dashed lines represent the 25th and 75th percentiles of the response. The horizontal dotted line represents the manufacturer defined cut-point at 6 SFCs/well above background for a positive response. Interferon-γ response* is defined as the maximum of ESAT-6/CFP-10 minus spot count in negative control.
