Figure 2.

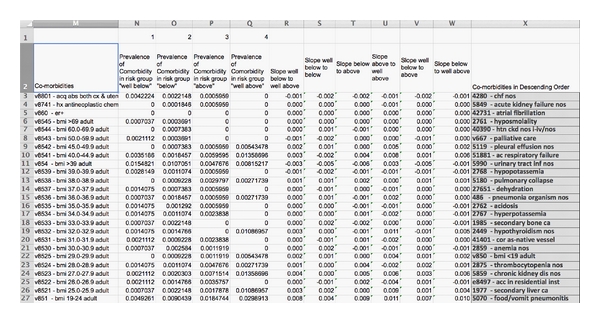
Slope of comorbidity prevalence among the commonest 100 base MSDRGs in all four levels of risk in the UHC methodology. Comorbidities are shown in descending order of slope magnitude.

Slope of comorbidity prevalence among the commonest 100 base MSDRGs in all four levels of risk in the UHC methodology. Comorbidities are shown in descending order of slope magnitude.