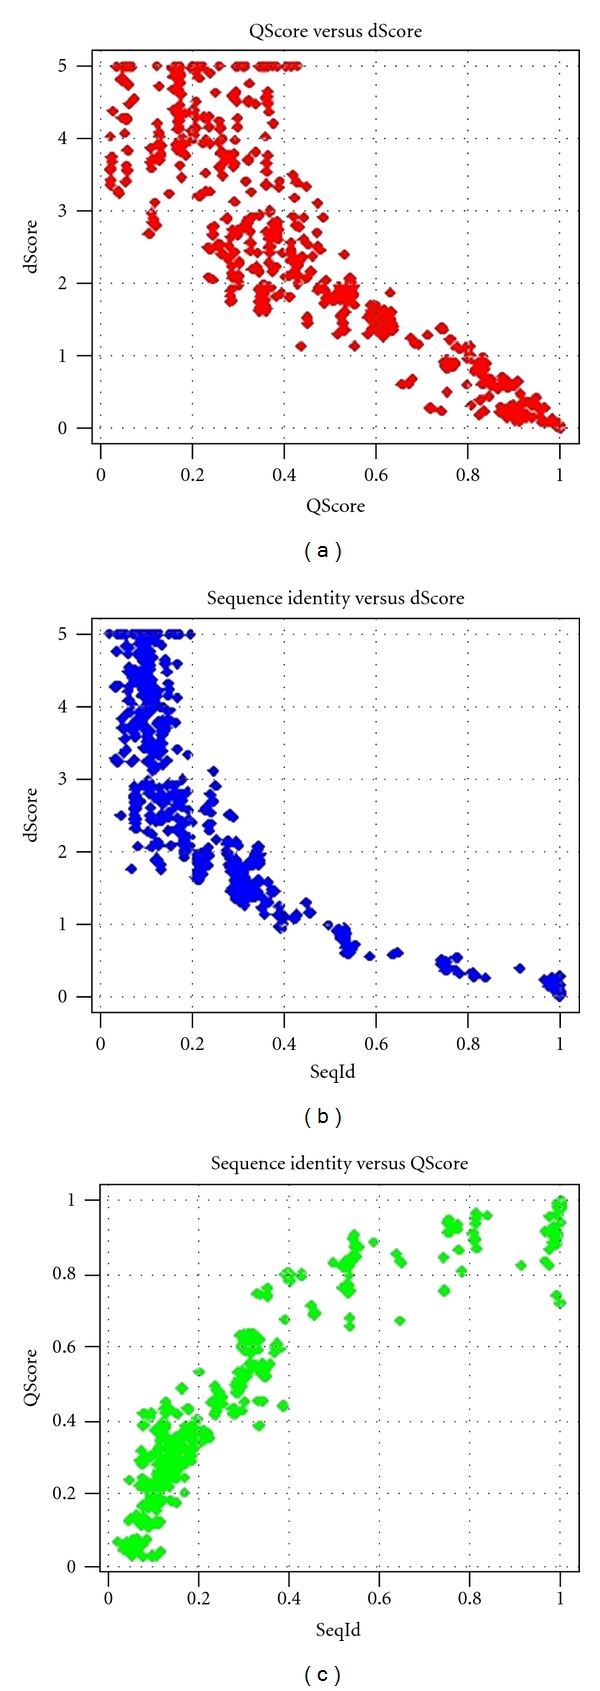
Figure 4.

Scatter plots of pairwise energy profile distance scores (dScores), structure alignment scores (QScores), and sequence identities of 7 proteins and their homologs. See text for further information.

Scatter plots of pairwise energy profile distance scores (dScores), structure alignment scores (QScores), and sequence identities of 7 proteins and their homologs. See text for further information.