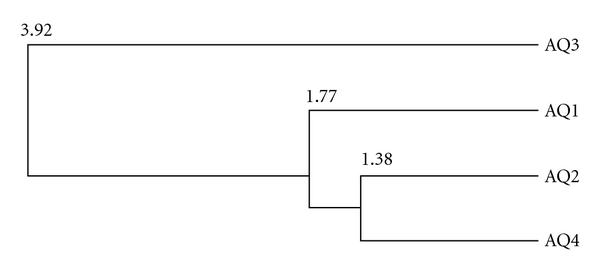
Figure 6.

The distance tree computed by the energy profile distance matrix of aquaporin-1, -2, -3 and -4 using the unweighted pair group method with arithmetic mean (UPGMA). The energy profiles of aquaporin-1, -2, and -4 show high similarities. The longer distance of aquaporin-3 correlates with higher differences to the energy profiles of the other aquaporins.
