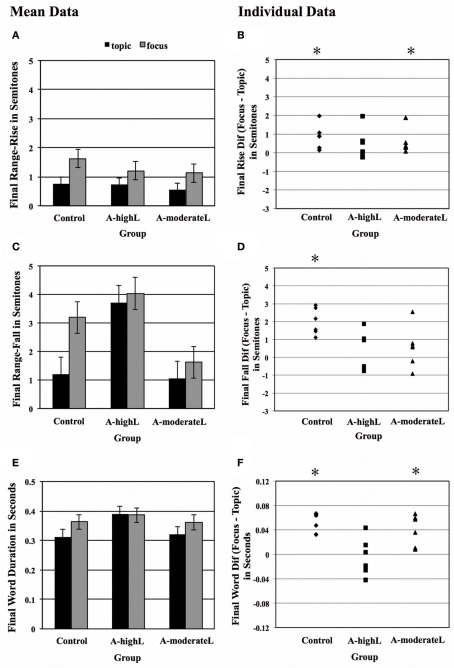
Figure 5.
Sentence-final results. (A) Mean range-rise and SE by group. (B) Individual data for range-rise difference (focus–topic) by group. Note that no difference between topic and focus is represented by the zero line. (C) Mean range-fall and SE by group. (D) Individual data for range-fall difference (focus–topic) by group. (E) Mean word duration and SE by group. (F) Individual data for duration difference (focus–topic) by group. *p < 0.05.

