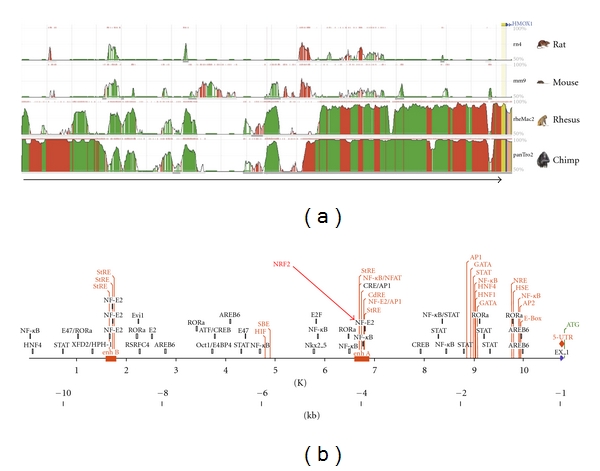
Figure 4.

Comparison of the HO-1 promoter sequences of different species. (a) Comparison of the 5′-flanking sequences (10 kb) of the rat, mouse, rhesus macaque, chimpanzee, and human (arrow) HO-1 gene using the ECR-Browser software (http://ecrbrowser.dcode.org/). The search area was 10 bp, and the minimal homology was 80%. The height of the curves (50% < X < 100%) indicates the homology (red: intergenic regions, green: single repeats, yellow: untranslated regions of the RNA (UTR), blue: exon, salmon: intron, pink ECR, above). (b) Map of transcription factor binding sites (TFBS) in the human HO-1 promoter. TFBS labeled in red have been verified experimentally in different cells systems (see also [33]).
