
Figure 5.
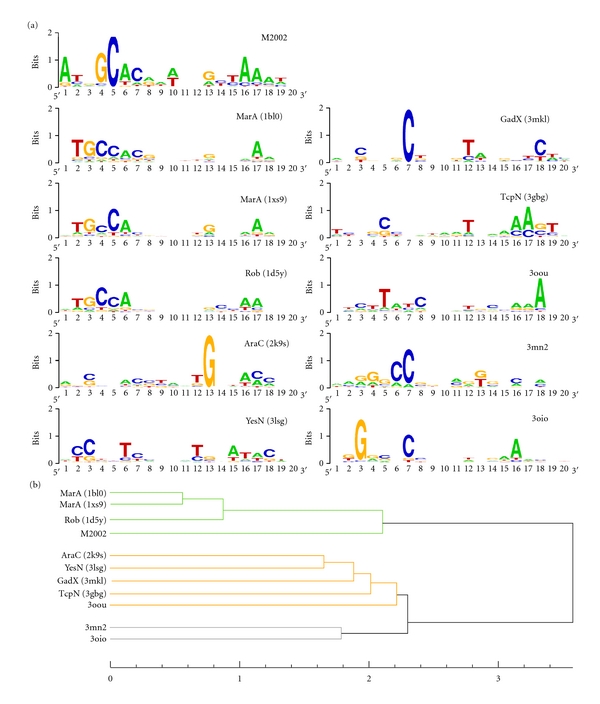
Sequence logos of predicted DNA binding sites and hierarchical clustering of the corresponding PWMs. (a) Sequence logos generated from an ensemble of top-scored random DNA sequences of protein-DNA complexes modeled after MarA (PDB code: 1bl0). M2002 denotes a set of 24 known binding sequences of the marA/rob/soxS regulon reported by Martin and Rosner in 2002 [32]. (b) Hierarchical clustering generated by calculating the Euclidean distance of the PWMs and applying the minimum variance clustering method (Ward's method). Three clusters are highlighted.