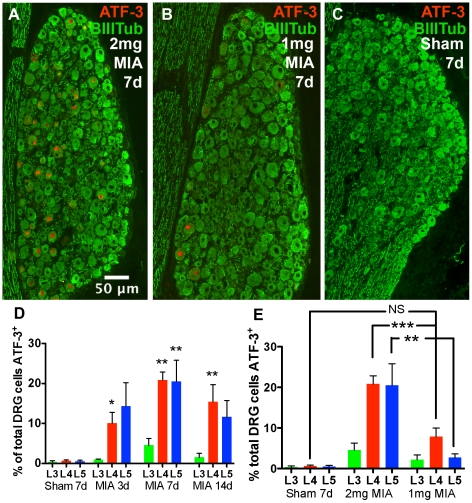
Figure 3. Approximation of total DRG ATF-3 expression.
A, B, C - DRG profiles show nuclear expression of ATF-3 7 days after 2 mg (A) or 1 mg (B) MIA, but not 14 days after saline sham injection (C). D - Estimated fraction of DRG profiles expressing ATF-3 in 2 mg MIA-treated animals (One-way ANOVA with Dunnett's multiple comparison test, n = 9×14d sham, 7×3d, 12×7d MIA, 7×14d MIA, P<0.01 **, P<0.05 *). E - Comparison of ATF-3 expression in 2 mg vs 1 mg MIA injected groups at 7 day timepoint (1 way ANOVA with Bonferroni's multiple comparison test, n = 9×7d sham, 12×2 mg MIA, 12×1 mg MIA, P<0.01 ** P<0.001 ***).

