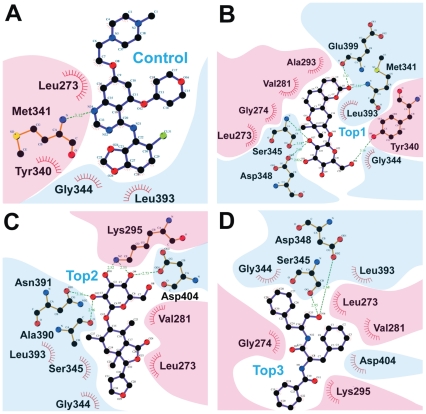
Figure 6. Ligplot diagrams illustrating protein-ligand interactions during docking.
(A) Saracatinib, (B) Isopraeroside IV, (C) 9HFG, and (D) aurantiamide. Hydrophobic interactions are represented by red spokes radiating towards the ligand atoms they contact. Ligands are represented in purple. C, N, O, and Cl atoms are represented in black, blue, red, and green, respectively. Pink backgrounds highlight amino acids of the small lobe (267–337), and blue background highlight those belonging to the large lobe (340–520). Hydrophobic interactions shown in this illustration are calculated through the Ligplot algorithm.

