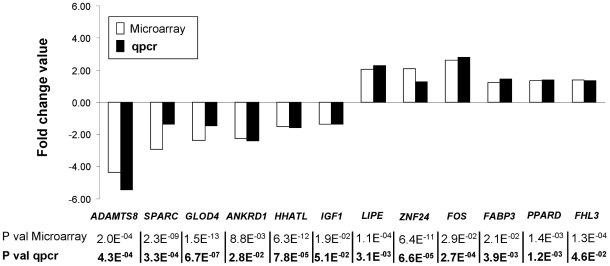
Figure 2. Validation of twelve microarray differentially expressed genes by quantitative PCR.
Fold change value is expressed as the expression ratio of Basque (B, n = 20) to Large White (LW, n = 20) samples when genes are highly expressed in Basque pigs and as the negative expression ratio of LW to B samples when genes are highly expressed in LW pigs. Statistical significances are reported below the plot as Benjamini and Hochberg adjusted P value for microarray data and as Student t-test P value for qPCR data (bold case). ADAMTS8, ADAM metallopeptidase with thrombospondin type 1 motif, 8; ANKRD1, ankyrin repeat domain 1; FABP3, Fatty acid-binding protein, heart; FHL3, Four and a half LIM domains 3; FOS, FBJ murine osteosarcoma viral oncogene homolog; GLOD4, glyoxalase domain containing 4; HHATL, hedgehog acyltransferase-like; IGF1, insulin-like growth factor 1; LIPE, lipase, hormone-sensitive; PPARD, peroxisome proliferator-activated receptor delta; SPARC, secreted protein acidic and rich in cysteine; ZNF24, zinc finger protein 24.

