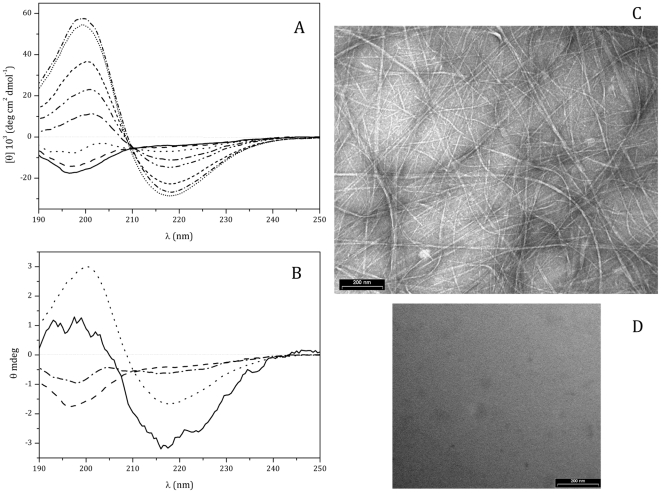
Figure 4. Characterization of N10K conformational transition.
A. Far-UV CD spectra of N10K (100 µM) in water, recorded as a function of time: time 0 (______); 1 h (— — ); 3 h (- - -); 5 h (— - — -); 7 h (— - - — - -); 20 h (– – –); 6 days (• • •); 20 days (— • — •). B. Interaction of N10K (1 mM) with C. albicans (5×10⁷ cell/ml) after 150 min incubation (______) using a 0.1 mm path lenght cell, 20°C. Fresh N10K in water (— —); after 150 min incubation (— - — -); after 570 min incubation (- - -). The samples in water were prepared taking aliquots of 100 µM from a 1.8 mM stock water solution and were collected with a 1 mm cell. For the sake of comparison of these CD profiles with the one obtained in the presence of C. albicans, the signal intensity of the water CD spectra has been divided by 10 and the ordinate kept in θ (mdeg). C. Electron micrograph of N10K prepared diluting 1∶5 the stock water solution stored at 4°C for 20 days. D. Electron micrograph of negative control peptide prepared in the same conditions.

