Fig. 2.

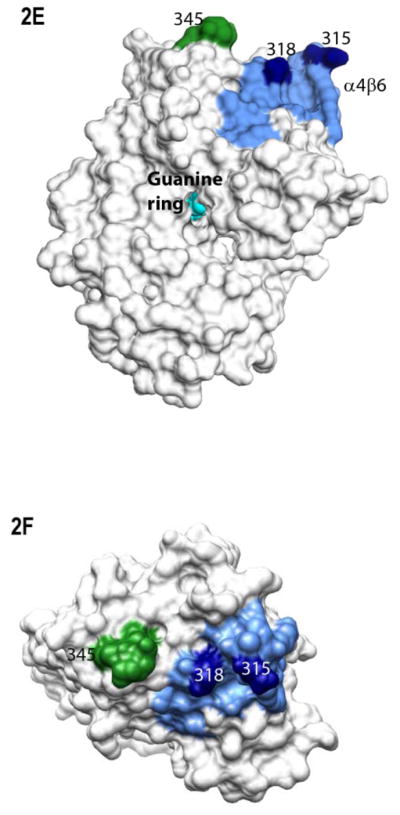
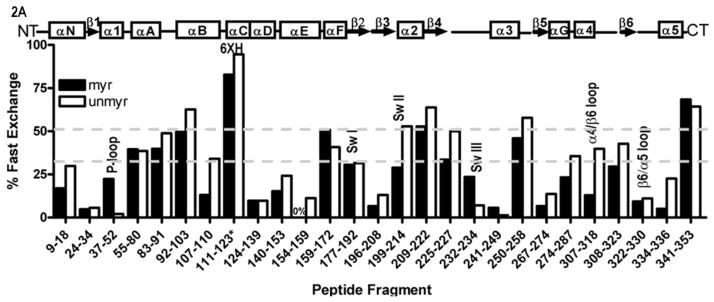
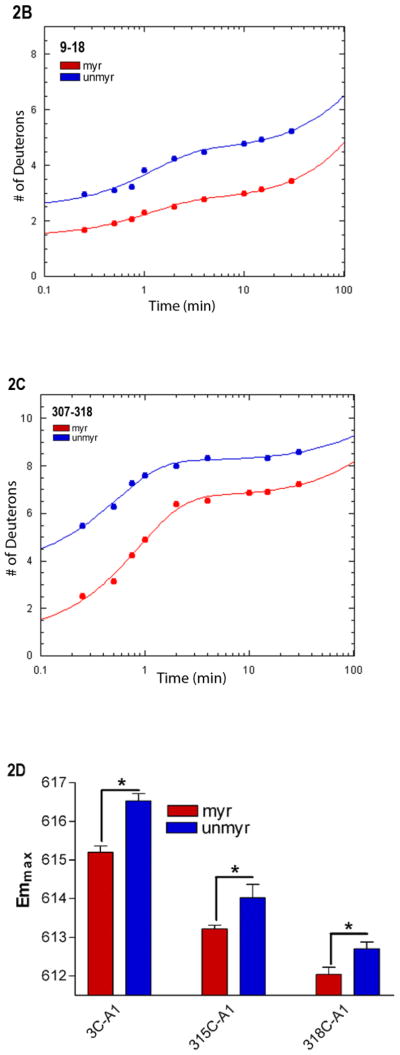
Myristoylation allosterically modifies environment of multiple regions within the activated Gα protein. Shown is the percentage of deuterium incorporation in each peptide as a percent of the total number of exchangeable backbone amide hydrogen in each peptide (y-axis), which occurs as a result of fast H/D exchange in indicated peptides of myrGαi (filled bars) and unmyrGαi (open bars), shown on the x-axis. The fits for all peptides can be found in Table S1, and peptide cleavage map of protein in Fig. S1. Regions of secondary structure are indicated along the top. *111–123 denotes the peptide which encompasses the hexahistadine tag (unnumbered) located between residues 119 and 120. Grey dotted lines indicate peptides with an overall high (≥ 50%, upper dotted grey line) or low (≤ 30%, lower dotted grey line) solvent accessibility regardless of myristoylation. (B–C) H/D Exchange kinetic rate profiles for peptides encompassing residues 9–18 (B) and 307–318 (C). Shown are the time-dependence of deuterium incorporation into peptides originating from myrGαiGDP•AlF4 (red spheres) and unmyrGαiGDP•AlF4 (blue spheres) as a function of incubation time in D2O. Each time point is the average of two independent experiments; results were fit to a single or double exponential equation according to Eq. (2), with fitted parameters shown in Table S1. (D) Emmax for the indicated A1-labeled Gαi HI proteins after AlF4 activation was determined as described in methods from excitation at 580 nm and scanning peak emission between 590–750 nm in a minimum of 3 independent experiments; results are mean ± SEM. (E–F) Surface of unmyrGαiGDP•AlF4, from 1GFI (2), with the last resolved residue in C terminus in dark green, shown to indicate receptor-binding face of protein. Light blue indicates α4/β6 loop region, with darker blue indicating position of indicated α4/β6 residues which were analyzed in 2D. (E) Side view; (F) view of protein which faces receptor. Surface of 1GFI (2) rendered with Chimera (66).


