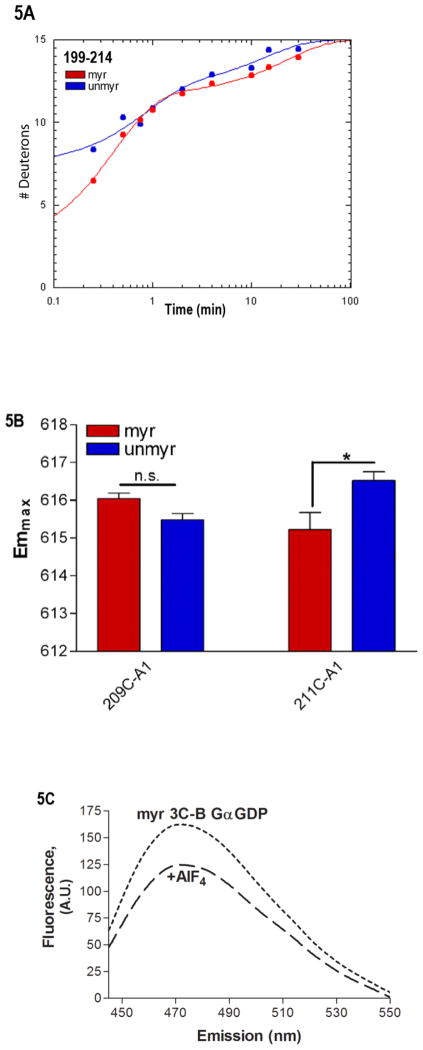
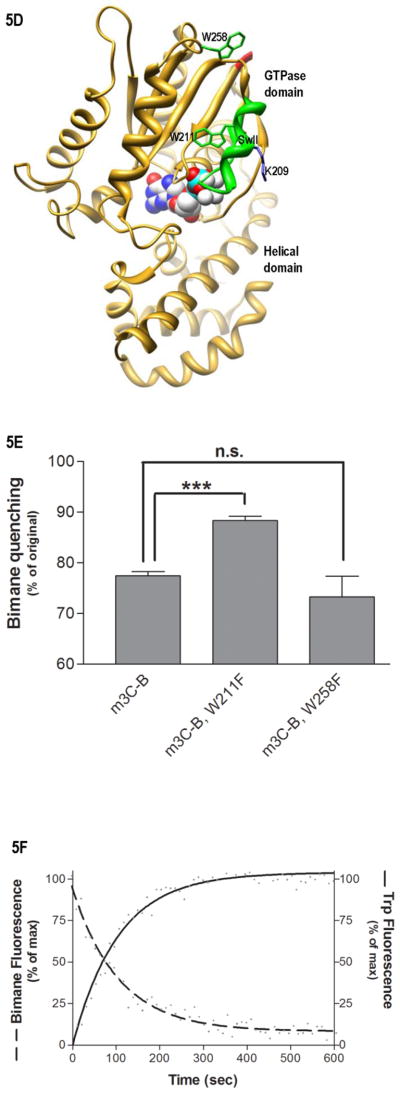
Fig. 5.
Environment of SwII. (A) Shown is the time-dependence of H/D exchange (as described in Fig. 2) for the peptide spanning residues 199–214 encompassing the SwII region. (B) Emmax for the indicated A1-labeled Gαi HI proteins after AlF4 activation was determined from excitation at 580 nm and scanning peak emission between 590–750 nm in a minimum of 3 independent experiments as described in methods; results are mean ± S.E.M. (C) Representative trace of bimane emission from myrGαi HI protein labeled at the third residue with bimane. Emission was scanned between 430–550 nm with excitation at 375 nm, before (dotted line) and after (dashed line) activation with AlF4 as described in methods. (D–F) Localization of N terminus in myrGαi proteins. (D) Location of Trp residues (side chains shown in green) located within the GTPase domain of Gαi, with last resolved N-terminal residues shown in red, and SwII region containing W211 in green ribbon, (1GFI (2) rendered with Chimera (66)). (E) Quantitation of activation-dependent quenching of bimane fluorescence performed on N-terminally labeled myr proteins containing native Trp at positions 211 and 258 (left bar), or with either Trp mutated to Phe (right two bars), as described in methods. Results are the average of three independent experiments, ± SEM. (F) Dashed line: time-dependent decrease in bimane fluorescence (ex/em 375/470 nm) upon addition of 10 μM GTPγS to GDP-bound myrGαi HI W258F-3C-bimane, performed in triplicate, and fit to a single exponential curve shown. Solid line: time-dependent increase in Trp fluorescence (ex/em 280/340) upon addition of 10 μM GTPγS to GDP-bound (unlabeled) myrGαi HI W258F-3C, performed in triplicate, and fit to a single exponential curve shown, using GraphPad Prism 4.0. Assays performed at 18 °C as described in methods. Data are the average of three independent experiments.


