
Figure 4.
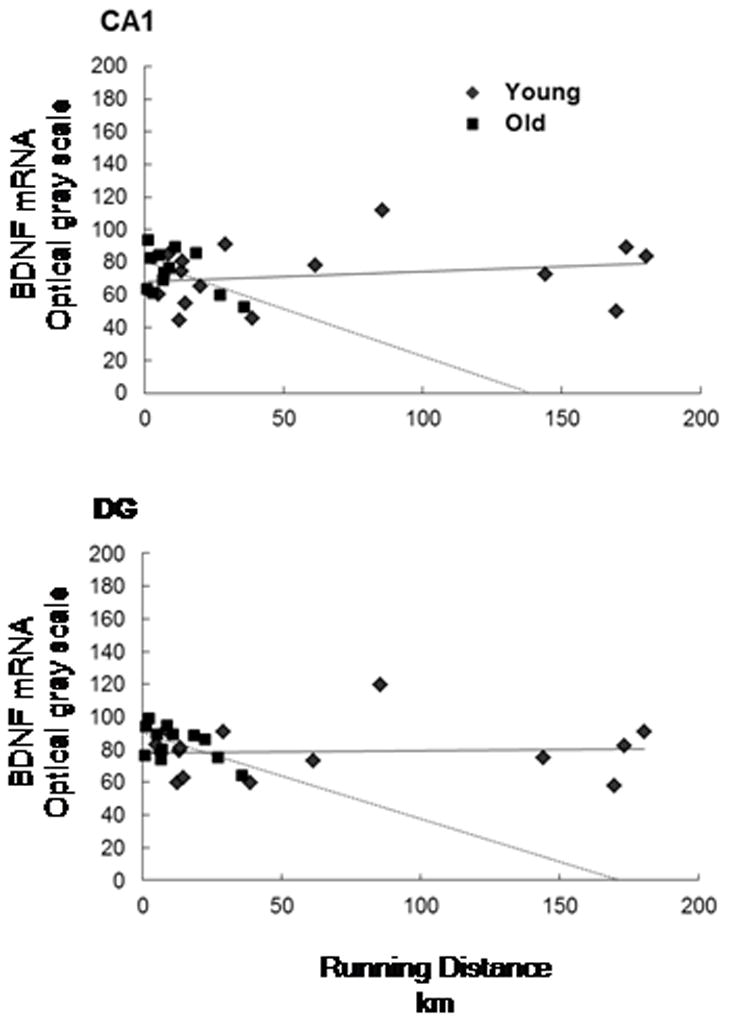
Scattergram of total running distance and BDNF mRNA optical grayscale values for region CA1 of the hippocampus (top) region DG of the hippocampus (bottom) according young and old age groups.
Official websites use .gov
A
.gov website belongs to an official
government organization in the United States.
Secure .gov websites use HTTPS
A lock (
) or https:// means you've safely
connected to the .gov website. Share sensitive
information only on official, secure websites.
Scattergram of total running distance and BDNF mRNA optical grayscale values for region CA1 of the hippocampus (top) region DG of the hippocampus (bottom) according young and old age groups.