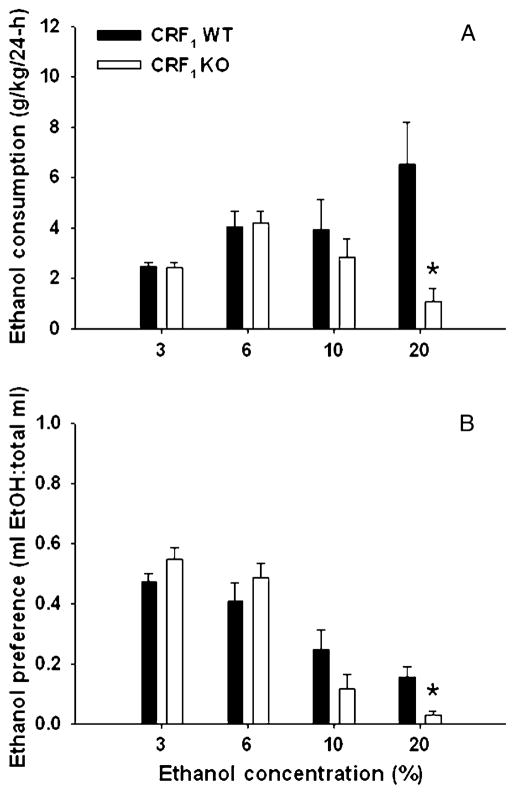
Fig. 1.
Twenty-four-hour, two-bottle choice EtOH consumption (a; mean ± SEM) and preference (b; mean ± SEM) in CRF1 KO and WT mice (n=12 per genotype). Means for each concentration of EtOH represent the average of days 2 and 4. Increasing concentrations of EtOH (3% to 20%) were offered at 4-day intervals. *p<0.01 for the difference between WT and KO mice at the 20% concentration

