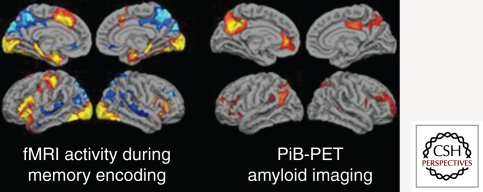
Figure 2.
(Left) Group map of fMRI activity showing regions that increase activity (yellow/red) or decrease (blue) activity during successful encoding. (Right) Group map of 11C-PiB retention in a group of non-demented older individuals. Note the anatomic overlap of PiB retention to default network (regions in blue on left).

