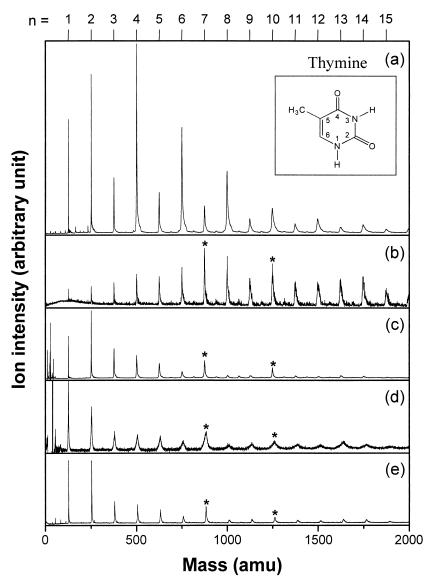
Figure 2.
Mass spectra of thymine clusters obtained by linear TOF MS. (a) One-color R2PI spectrum using a 6-ns laser pulse at 274 nm at a fluence of 1.6 × 10⁶ W/cm2. (Inset) The molecular structure of thymine. (b) The same spectrum as a obtained at a lower fluence of 5.3 × 10⁵ W/cm2. (c) One-color (2 + 1) resonance-enhanced multiphoton ionization spectrum using a 6-ns, 4.0 × 10⁸-W/cm2 laser pulse at 355 nm. (d) Electron impact ionization mass spectrum at a 30-eV electron energy. (e) The same spectrum as a obtained by using a 400-fs, 3.2 × 10¹¹-W/cm2 laser pulse centered at 267 nm. Peaks denoted by * at n = 7 and 10 in b–e may indicate the stability of these clusters as neutrals.

