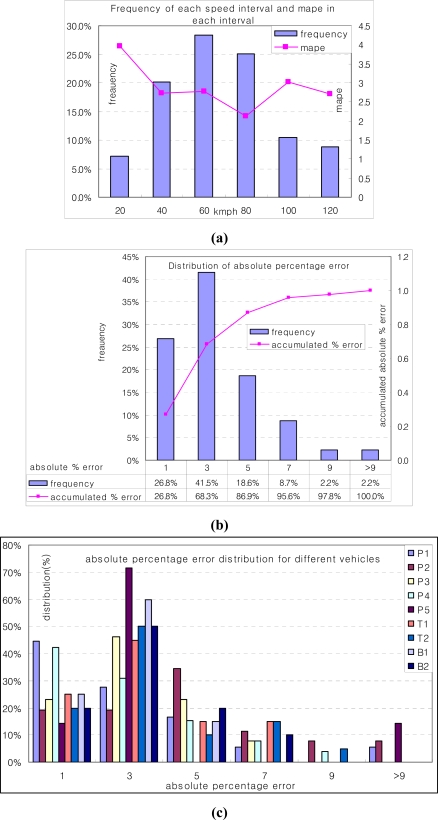
Figure 10.
(a) Speed distribution (in the left vertical axis) and MAPE (in the right vertical axis) for each speed interval. (b) Absolute percentage error distribution in measured speed. Horizontal axis represents absolute percentage error. Left vertical axis means frequency of each absolute percentage error. Right vertical axis indicates accumulated distribution of absolute percentage error. (c) Absolute percentage error distribution for different vehicles.

