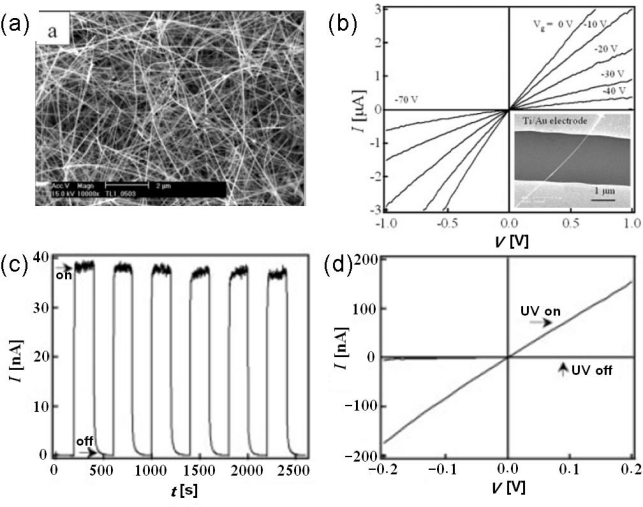
Figure 4.
(a) Scanning electron microscope (SEM) image of SnO2 NWs; (b) Gate-dependent I–V curves of a single SnO2 NW device; (c) I–t curve recorded with the UV illumination turned on and off repeatedly; (d) I–V curves taken with and without UV illumination. Reproduced from [46].

