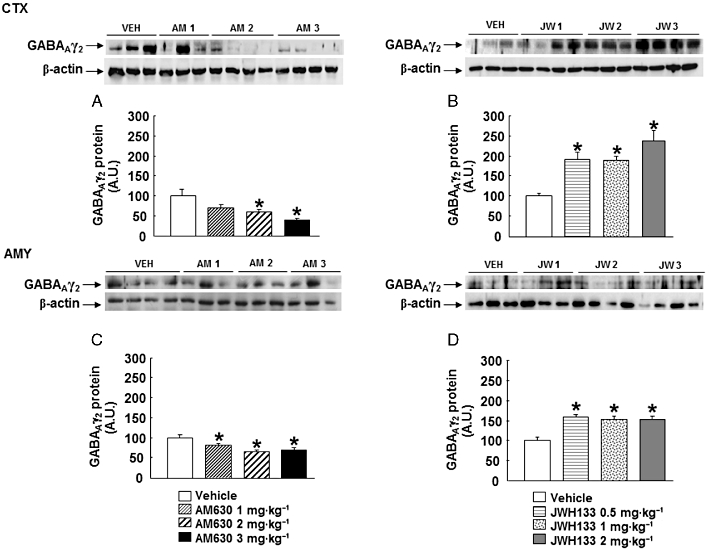
Figure 8.

Assessment of GABAAγ2 protein expression in the cortex (CTX) and amygdala (AMY) of chronic AM630- or JWH133-treated mice. Western blot and densitometric analysis of GABAAγ2 protein were examined in the cortex and amygdala of Swiss ICR mice treated with AM630 (1, 2 or 3 mg·kg−1, twice a day) (A, C) or JWH133 (B, D) (0.5, 1 or 2 mg·kg−1, twice a day) for 7 days. Data are normalized by β-actin (lower band) and are representative of three experiments. Columns represent the means and vertical lines represent the SEM of GABAAγ2 protein expression. *P < 0.05, significantly different from corresponding vehicle (VEH)-treated mice. A.U., arbitrary units.
