
Figure 2.
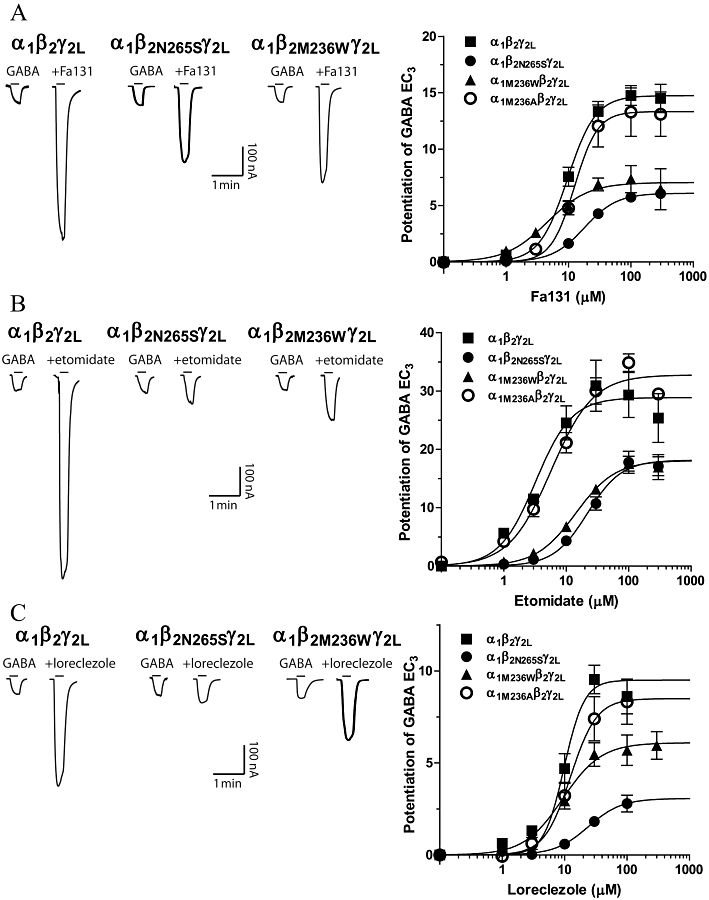
Potentiation of GABA current responses by Fa131 (A) and etomidate (B) and loreclezole (C) at α1β2γ2L, α1β2N265Sγ2L, α1M236Wβ2γ2L and α1M236Aβ2γ2L GABAA receptors expressed in Xenopus oocytes. Left panels show currents traces (nA vs. min) illustrating the enhancing effects of these drugs at different receptor types. Horizontal bars represent drug application. GABA alone corresponds to EC3, determined for each oocyte expressing each subunit combination, and was approximately 5 µM (α1β2γ2L), 7 µM (α1β2N265Sγ2L), 0.2 µM (α1M236Wβ2γ2L) and 3 µM (α1M236Aβ2γ2L). Current traces shown correspond to 10 µM Fa131, 3 µM etomidate and 10 µM loreclezole application. Right panels are full concentration-response curves for the potentiating effects of these drugs on GABA-elicited currents, at each receptor subtype. Data points represent mean ± SEM (n ≥ 4) of peak current response normalized as described in Methods. Data were fitted using four-parameter logistic equation and the best-estimated values for each parameter are detailed in Table 1.