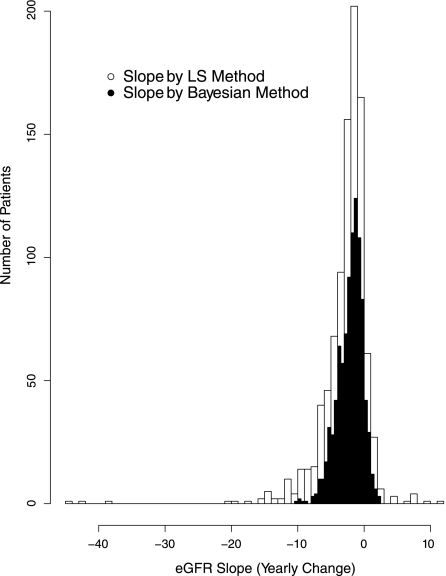
Figure 1.
Distribution of estimated eGFR slopes (least-squares versus Bayesian) of study participants. This graph shows the histograms that compare the distribution of the least-squares eGFR slopes obtained by applying linear regression to individual participant with the Bayesian estimates obtained from the Bayesian linear mixed models.

